
ZigZag Indicators
Browse ZigZag indicators that simplify swings and structure on the chart. These indicators and chart tools can help identify pivots, wave-like moves, and cleaner pattern visibility for your trading strategy. Useful as a visual filter for trend vs range conditions, and for aligning entries with higher-timeframe structure on Forex pairs, gold, or indices.
工具
工具比较
常见问答







工具比较
产品 | 评价 | 下载 | 销售 | 价格 | 兼容平台 |
|---|---|---|---|---|---|
ZigZag | 4.3 (6) | 4.42K | — | 免费 | Windows 版、Mac 版 |
SwingHighLow | 4.3 (3) | — | 12 | $19 起 | Windows 版、Mac 版 |
Market Trend OB | 5.0 (1) | 978 | — | 免费 | Windows 版、Mac 版 |
Dynamic Market Structure Analysis of Turning Points | 4.3 (3) | — | 11 | $19 | Windows 版、Mac 版 |
ZIG ZAG Free | 5.0 (1) | 846 | — | 免费 | Windows 版、Mac 版 |
VegaXLR - ZigZag Alerts | 4.3 (3) | — | 11 | $20 | Windows 版、Mac 版 |
S&R Structural ZigZag | 5.0 (2) | 697 | — | 免费 | Windows 版、Mac 版 |
ZigzagSR | 4.3 (4) | — | 8 | $19 | Windows 版、Mac 版 |
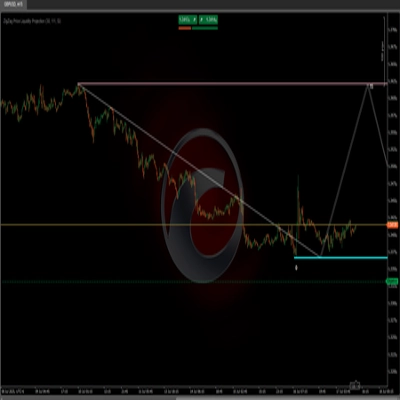
ZigZag Price Liquidity Projection | — | 417 | — | 免费 | Windows 版、Mac 版 |
LT_SmartSwings | 5.0 (2) | — | 7 | $19 | Windows 版、Mac 版 |
HKTrading Free ZigZag | 5.0 (1) | 326 | — | 免费 | Windows 版、Mac 版 |
LT_Ind_SRZones | 4.5 (6) | — | 5 | $19 | Windows 版、Mac 版 |
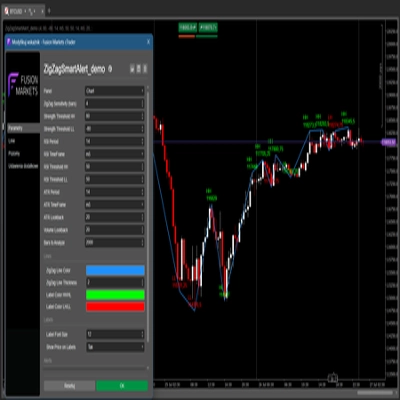
ZigZagSmartAlert_demo | — | 188 | — | 免费 | Windows 版、Mac 版 |
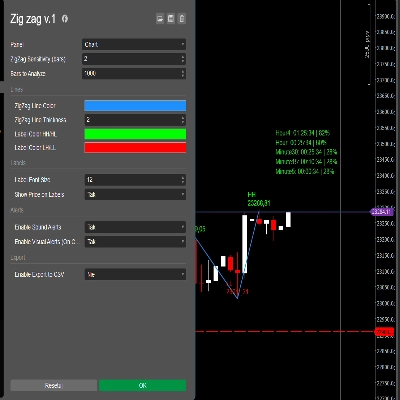
Zig zag v.1 | 4.0 (2) | — | 3 | $19 | Windows 版、Mac 版 |
Double Top and Bottom Pivots | — | 185 | — | 免费 | Windows 版、Mac 版 |
Auto Chart Patterns | 4.6 (7) | — | 3 | $19 | Windows 版、Mac 版 |
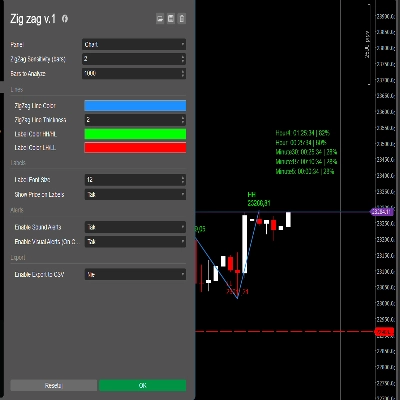
Zig zag v.1 Demo | 5.0 (1) | 177 | — | 免费 | Windows 版、Mac 版 |
Three Candle Patterns | 5.0 (2) | — | 3 | $19 | Windows 版、Mac 版 |
EMA MTF TREND | 4.5 (2) | — | 2 | $20 | Windows 版、Mac 版 |
High-Low Divergence [Iridio Capital] | 4.8 (4) | — | 2 | $9 起 | Windows 版、Mac 版 |
HTF candles with Timeframe Alignment | 4.5 (2) | — | 2 | $45 | Windows 版、Mac 版 |
Zigzag T3 | 4.7 (3) | — | 2 | $19 | Windows 版、Mac 版 |
Zig-Zag Extremity Tracker | 4.6 (5) | — | 2 | $19 | Windows 版、Mac 版 |
AutoLines™ Support & Resistance | 4.6 (5) | — | 2 | $19 | Windows 版、Mac 版 |
ZigZagSmartAlert | 4.3 (4) | — | 2 | $19 | Windows 版、Mac 版 |
Zigzag Trend | 4.5 (4) | — | 2 | $25 | Windows 版、Mac 版 |
Zig Zag ATR | 4.0 (2) | — | 2 | $19 | Windows 版、Mac 版 |
Swing Points | 4.5 (6) | — | 1 | $19 | Windows 版、Mac 版 |
SwingHighLowDetector | 4.8 (5) | — | 1 | $25 | Windows 版、Mac 版 |
Swing LowHigh | 4.7 (3) | — | 1 | $40 | Windows 版、Mac 版 |
Protected Swings | 4.5 (2) | — | — | $30 | Windows 版、Mac 版 |
OBScope | 5.0 (3) | — | — | $19 | Windows 版、Mac 版 |
OHLC and SMC - Market Structure | 4.3 (3) | — | — | $19 | Windows 版、Mac 版 |
HiLo Marker | 4.5 (4) | — | — | $29 | Windows 版、Mac 版 |
Apex Fibo Tracer | 5.0 (3) | — | — | $69 | Windows 版、Mac 版 |
常见问答
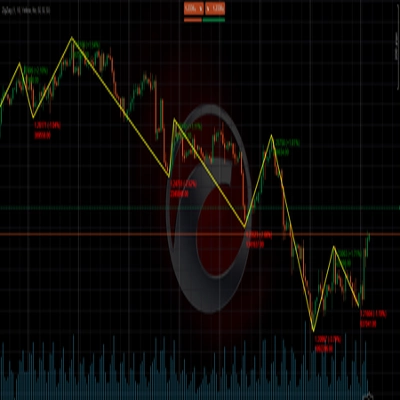
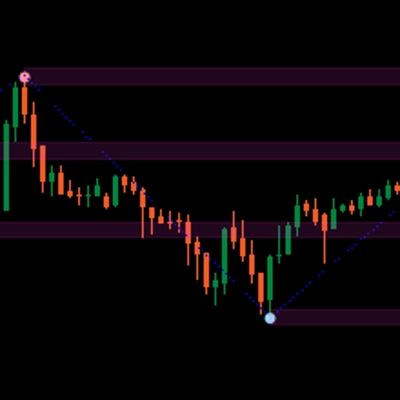
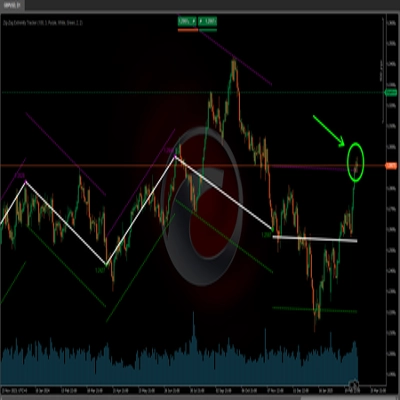
ZigZag connects significant swing highs and lows with straight lines, ignoring any move smaller than a set threshold so that minor noise disappears. Traders use it to see structure, wave legs and pattern points at a glance, and to anchor Fibonacci or harmonic measurements.
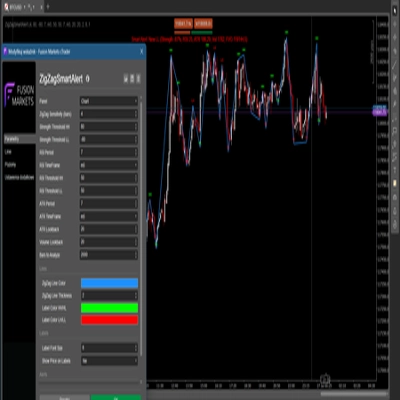
Deviation is the smallest reversal, in points, percent or ATR, that starts a new leg. Depth is the bar window in which a pivot must be the extreme, backstep limits how soon a pivot can be replaced, and raising these values gives fewer, larger swings.
The final leg stays provisional until price reverses by the deviation threshold, so its end point moves with every new extreme. Completed legs look ideal in hindsight for the same reason, so ZigZag describes past structure rather than giving real-time entry signals, and trading from hindsight patterns can lead to losses.
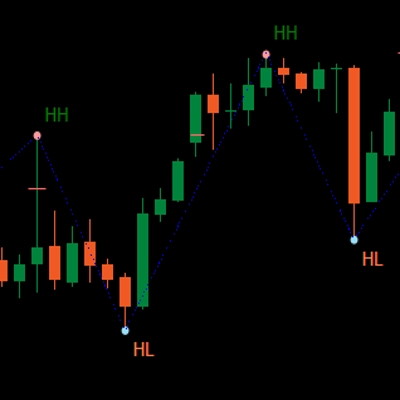
Experienced users often value swing labels such as higher high and lower low, alerts on new pivots, Fibonacci levels on legs and multi-timeframe ZigZags. Someone new to charts may read one plain ZigZag with a moderate threshold more clearly, and comparing how each build treats the unfinished last leg is a useful test.
Store ZigZag tools run on cTrader's Windows and Mac apps only, where you attach one from the chart's indicator list and set its deviation per symbol. Each instance keeps separate settings, so many traders run a wide ZigZag on a daily chart for structure and a tighter copy on the chart they trade.