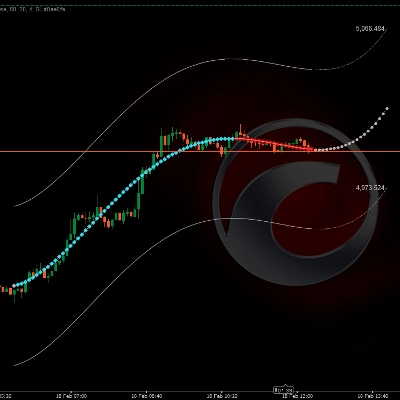
📊 قناة توقع السعر متعددة الحدود
https://chartshots.spotware.com/c/699603101593d
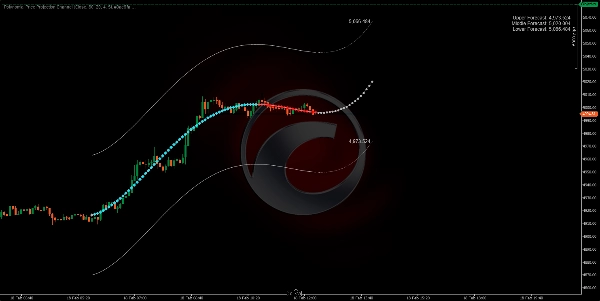
🔎 ماذا يفعل؟
https://chartshots.spotware.com/c/69960348da652
يناسب منحنى رياضي على إغلاقات الأسعار الأخيرة N و يمتد به إلى المستقبل كتوقع. حول هذا المنحنى يرسم قناة علوية وسفلية يتكيف عرضها تلقائيًا مع تقلبات السوق الأخيرة.
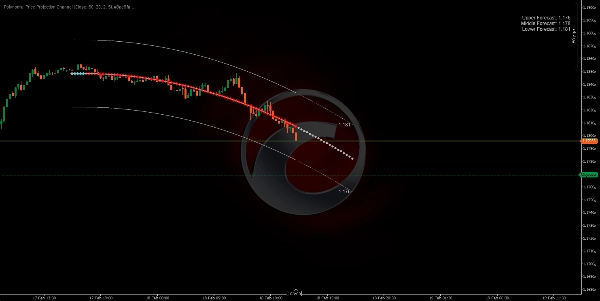
⚙️ كيف تعمل المنطق؟
- يأخذ آخر N شموع (أشرطة النظر للخلف) ويحسب منحنى متعدد الحدود الذي يناسب تلك الأسعار بأفضل شكل باستخدام طريقة المربعات الصغرى.
- يمتد المنحنى إلى الأمام (أشرطة التوقع) كتوقع رياضي للاتجاه الحالي.
- يبني القناة عن طريق تحريك المنحنى لأعلى ولأسفل باستخدام أقصى نطاق شمعة للفترة المحللة × 2.
https://chartshots.spotware.com/c/6996039a07e3a
🛠️ المعلمات الرئيسية
المعلمة
الافتراضي
الغرض
أشرطة النظر للخلف
80
عدد الشموع التاريخية التي يحللها
أشرطة التوقع
20
عدد الشموع التي يتوقعها للأمام
رتبة متعددة الحدود
4
مرونة المنحنى (الأعلى = منحنيات أكثر)
مدخلات البيانات
الإغلاق
السعر الأساسي للحساب
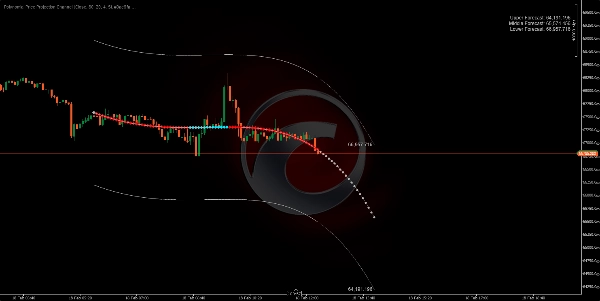
🎯 كيف تستخدمه؟
🟢 شراء محتمل → يلمس السعر الشريط السفلي ويتجه التوقع للأعلى.
🔴 بيع محتمل → يلمس السعر الشريط العلوي ويتجه التوقع للأسفل.
⚠️ تأكد دائمًا من عوامل أخرى قبل التداول. هذا المؤشر هو استقراء رياضي، وليس توقعًا مضمونًا.
5 | 0 % | |
4 | 100 % | |
3 | 0 % | |
2 | 0 % | |
1 | 0 % |


