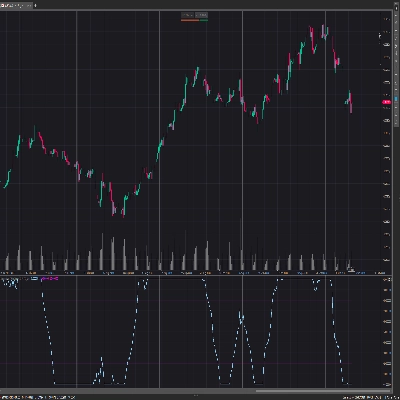
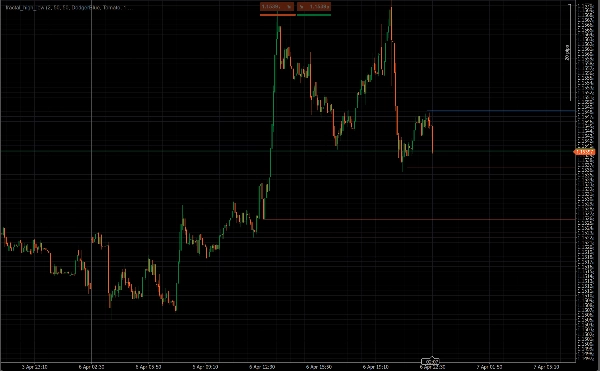
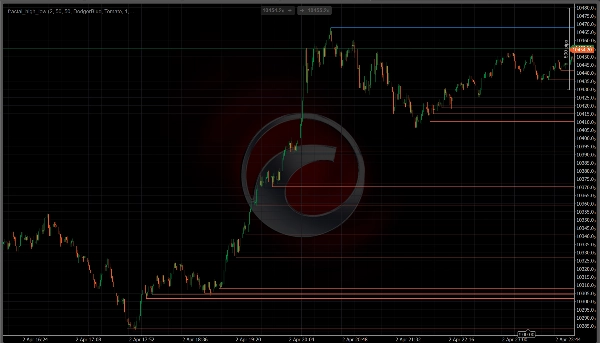
Trading product for fractal_high_low مؤشر BTCUSD Prop, image 1
مؤشر
141 التنزيلات
الإصدار 1.1، Apr 2026
Windows, Mac
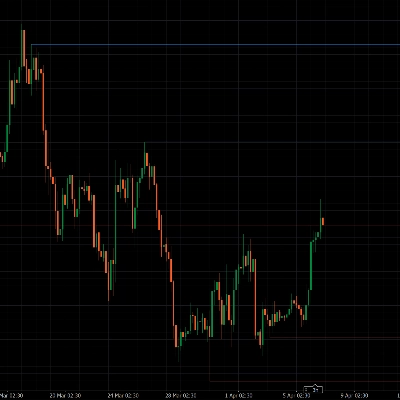
Trading product for fractal_high_low مؤشر BTCUSD Prop, image 2
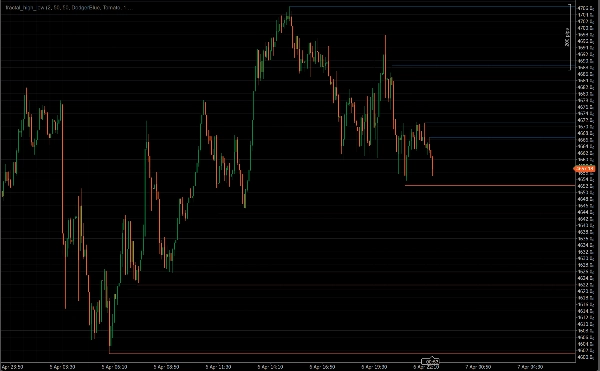
Trading product for fractal_high_low مؤشر BTCUSD Prop, image 3
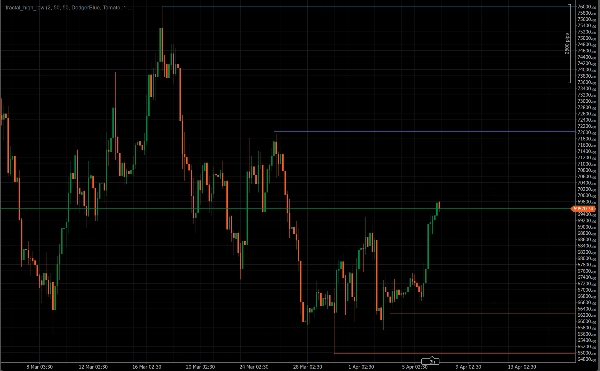
Trading product for fractal_high_low مؤشر BTCUSD Prop, image 4
Trading product for fractal_high_low مؤشر BTCUSD Prop, image 5
منذ 20/09/2025
123.87M
حجم التداول
736.77K
الربح بالبيب
141
التثبيتات المجانية

الوصف

إذا كنت تتداول حركة السعر، فأنت تعرف بالفعل أن أهم

المستويات على أي مخطط هي القمم والقيعان الفركتالية —

نقاط التأرجح حيث رفض السعر، أو انعكس، أو اخترق

البنية. يقوم مؤشر Frac High Low Lines بإيجاد تلك النقاط لك

ويرسمها تلقائيًا، حتى تتمكن من التركيز بالكامل على

قراءة السعر بدلاً من إدارة الرسومات.


──────────────────────────────────────────────────────────

كيف يعمل

──────────────────────────────────────────────────────────


يستخدم المؤشر منطق الفركتال الكلاسيكي لويلمز لتأكيد

نقاط المحور. القمة الفركتالية صالحة فقط عندما تكون قممها

أعلى بشكل صارم من الأعمدة المحيطة على الجانبين. القاع

الفركتالي صالح فقط عندما يكون قاعه أدنى بشكل صارم.

بمجرد التأكيد، يتم رسم خط أفقي من تلك النقطة

ويمتد للأمام — مما يمنحك مرجعًا بصريًا واضحًا

لكل مستوى هيكلي مهم على المخطط.


لا يعيد الرسم. يتم تأكيد الفركتالات فقط بعد إغلاق عدد كافٍ من الأعمدة

على الجانبين، لذلك لا تظهر المستويات وتختفي مع تحرك السعر.


──────────────────────────────────────────────────────────

الميزات الرئيسية

──────────────────────────────────────────────────────────


• الكشف التلقائي عن الفركتال — يفحص جميع الأعمدة عند التحميل، ثم

يحدث تحديثات في الوقت الحقيقي مع تكوين أعمدة جديدة


• فترة الفركتال القابلة للتكوين — استخدم الفترة 2 لكل

تأرجح صغير، أو زدها لعزل القمم والقيعان الهيكلية الكبرى فقط


• التحكم في الحد الأقصى للخطوط — تحديد عدد خطوط المقاومة والدعم التي تظهر في وقت واحد بشكل مستقل،

مما يحافظ على نظافة المخطط وتركيزه على الهيكل الحديث


• إزالة المستويات المكسورة — إزالة خط تلقائيًا اختياريًا

عندما يغلق السعر من خلاله، بحيث تبقى المستويات غير المكسورة مرئية فقط


• تحكم بصري كامل — تعيين اللون، السماكة، ونمط الخط (صلب، متقطع، منقط) بشكل مستقل للقمم

والقيعان


• خفيف الوزن — يتم رسم كل خط مرة واحدة ولا يعاد رسمه أبدًا،

لذلك تبقى الأداء سلسًا حتى على مخططات M1 أو M5


──────────────────────────────────────────────────────────

لمن هو

──────────────────────────────────────────────────────────


مصمم خصيصًا للمتداولين بحركة السعر الذين يستخدمون القمم

والقيعان التأرجحية لتحديد الهيكل، تخطيط دخول الصفقات،

تعيين وقف الخسارة، ورصد مناطق الانعكاس أو الاختراق المحتملة.

يعمل على أي رمز وأي إطار زمني في cTrader.


──────────────────────────────────────────────────────────

مجاني — بدون شروط

──────────────────────────────────────────────────────────


Frac High Low Lines مجاني تمامًا. قم بتثبيته، أضفه

إلى مخططك، وتداول مع مستويات هيكلية أنظف من

جلسة التداول الأولى الخاصة بك.


==========================================================

الملخص

ملخص الذكاء الاصطناعي
fractal_high_low is an indicator designed for price action traders to automatically identify and plot fractal high and low lines on trading charts. It uses classic Williams fractal logic to detect pivot points where price has reversed or broken structure, confirming fractal highs when a bar’s high is strictly greater than its neighbors, and fractal lows when a bar’s low is strictly lower. Upon confirmation, horizontal lines are drawn from these pivot points and extended forward, providing clear visual references for significant support and resistance levels.
The indicator updates in real time as new bars form and scans all bars on load. It offers configurable fractal periods to capture minor or major swings, controls to limit the number of displayed lines for clarity, and an option to automatically remove lines when price closes through them. Users can customize line color, thickness, and style independently for highs and lows. The indicator is lightweight, drawing each line once to maintain smooth performance even on low timeframes like M1 or M5.
fractal_high_low works on any symbol and timeframe within the cTrader platform and supports markets including Forex, stocks, commodities, indices, and cryptocurrencies. It aids traders in identifying market structure, planning entries, setting stops, and spotting reversal or breakout zones.
ملف تعريف المؤشر
فئة المؤشر
هيكل السوق (SMC)
نوع المخرجات
الإشارات
التصور
متطلبات البيانات
أعمدة السعر فقط
الإشارات المدعومة
لمس المستوى
كسر المستوى

تقييمات العملاء

0.0
التقييمات: 0
تقييمات العملاء
لا توجد تقييمات لهذا المنتج حتى الآن. هل جرَّبته بالفعل؟ كن أول من يخبر الآخرين!

مناقشة

الأسئلة الشائعة

BTCUSD
Prop
Forex
Scalping
Indices
EURUSD
Commodities
Crypto
Stocks
XAUUSD
NAS100
يتم توفير المنتجات المتاحة من خلال cTrader Store، بما في ذلك روبوتات التداول والمؤشرات والإضافات، من قبل مطوري الطرف الثالث وإتاحتها لأغراض الوصول المعلوماتي والفني فقط. cTrader Store ليس وسيطًا ولا يقدم نصائح استثمارية أو توصيات شخصية أو أي ضمان للأداء المستقبلي.

قد يعجبك أيضًا

مؤشر
RSI
Key Levels
+1
High-precision TDI indicator with Shark Fin & Extreme Cross signals for spotting rapid market reversals.
مؤشر
Forex
NAS100
+3
volumen perfile
مؤشر
ATR
Prop
+14
Optimize exits with Chandelier Exit! Visualize stop-loss points dynamically for improved trading precision and safety.
مؤشر
ATR
Engulfing
+5
This indicator maps D1, H4, H1 and 15M Multi-Timeframe Bias and Fresh High Probability Supply and Demand zones
مؤشر
VWAP
Volume
+5
The MA Quant Volume Profile Custom Range is a trading indicator that analyzes volume distribution across the price.
مؤشر
Prop
Forex
+9
Average Cost Price helps you keep track of your open positions on the chart. In doing so, it provides lines and explanat
مؤشر
ATR
Volume
+4
This allows traders to see not just the trend, but whether the momentum itself is overextended.
مؤشر
Grid
Prop
+18
Volumen Delta", es una representación visual del flujo de órdenes basada en el volumen de transacciones.
مؤشر
Signal
The Dark Cloud Cover indicator detects a bearish reversal pattern, marking key candles and confirming signals based on v
مؤشر
BOS
Imbalance
+4
Automatically detects and highlights both Bullish and Bearish Fair Value Gaps (FVGs).
مؤشر
SMC
Prop
+13
Perfect for traders who demand a clear overview of multiple timeframes at a glance.
مؤشر
BOS
MSS
+3
Maps BOS, CHoCH, swing breaks and market structure shifts directly on your cTrader chart.
مؤشر
JMA-like is a highly responsive and ultra-smooth moving average designed to replicate the behavior of the original JMA!
مؤشر
Liquidity Grab
Liquidity Sweep
+2
Visualizes accumulation ranges, manipulation sweeps and distribution phases on your cTrader chart.
مؤشر
Prop
VWAP
+12
Visualize trading volume by price within any range, highlight POC and key value areas.
مؤشر
MSS
Key Levels
+4
Maps session ranges, previous highs/lows, equilibrium and premium/discount zones on your cTrader chart.
مؤشر
RSI
Forex
+4
High-probability trading signals in the fast-paced world of forex and CFD trading.
مؤشر
Order Block
Fair Value Gap
+2
This indicator contains most of the ICT strategies that you need. You can turn on/off each one to be shown.

السعر

منذ 20/09/2025
123.87M
حجم التداول
736.77K
الربح بالبيب
141
التثبيتات المجانية