present
Sign up and get $50 off your first purchase
Trading product for RejectionZoneSignals Indicator ADX EMA, image 1
RejectionZoneSignals
Indicator
Version 1.0, May 2026
Windows, Mac
Trading product for RejectionZoneSignals Indicator ADX EMA, image 2
Since 19/12/2025
734.58K
Traded volume
58.42K
Pips won

Description

Rejection Zone Signals

A trend-pullback indicator that combines a Fast/Slow MA "rejection zone" with full risk-management visualization. Designed for discretionary intraday traders who want a clean, repeatable framework on 5m / 15m / H1 timeframes.

How it works

Trend bias is set by the Fast vs Slow moving average (default EMA 20 / EMA 50). When price pulls back into the band between the two MAs and then closes back outside in the trend direction with a confirming candle, the indicator fires an entry signal β€” but only if the optional 200-MA confluence and ADX filters agree.

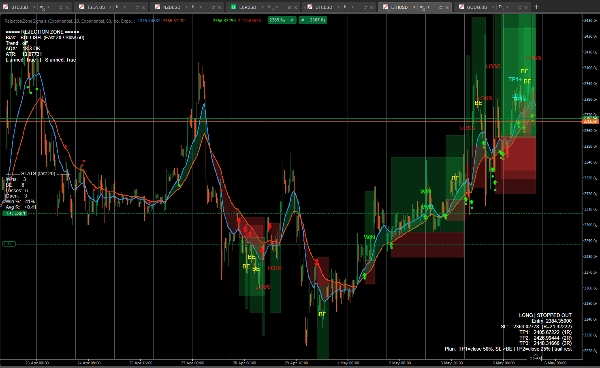
Each entry generates a complete trade plan on the chart: entry level, ATR-based stop loss, and three take-profit targets at 1R / 2R / 3R, drawn as a cTrader-style risk/reward box pair.

Features

  • Filled MA cloud (green when bullish, red when bearish) β€” the visible "rejection zone"
  • Optional 200-MA trend filter rendered on chart
  • Wilder ADX(14) chop filter to skip ranging markets
  • ATR-based stop loss with editable multiplier
  • TP1 / TP2 / TP3 targets at customizable R-multiples
  • R:R box visualization: red risk box (entry β†’ SL), green reward box (entry β†’ TP3)
  • Boxes auto-close at the bar where exit conditions are met β€” no clutter from unfinished levels
  • Per-setup outcome badges: WIN / LOSS / BE / OPEN / TP1+ / TP2+
  • Live stats panel: wins, losses, breakeven count, win rate, average R
  • Sound alert on entry plus dedicated Long/Short signal outputs for cTrader's email/push alerts
  • Fully configurable: MA types, lengths, filter thresholds, risk parameters, display toggles

Suggested usage

  1. Identify a trending instrument with a higher-timeframe scanner or your own bias.
  2. Load the indicator on 15m or 5m.
  3. Wait for an arrow that aligns with your higher-timeframe direction.
  4. Enter at the yellow entry level, place stop and TPs at the drawn lines.
  5. At TP1: close 50%, move SL to breakeven. At TP2: close 25%. Trail the rest with the Fast MA.

Notes

The indicator processes every tick; signals on the live (in-progress) bar may repaint until the bar closes. For zero-repaint entries, wait for bar close before acting. For ambiguous bars where both SL and a TP are touched, the outcome tracker assumes SL was hit first (conservative for stats).

This is a discretionary tool, not an automated system. Backtest on your symbols and timeframes before live use.

Summary

Indicator profile
Indicator category
Trend
Output type
Visualisation
Signals
Data requirements
Bars only
Tick data
Supported signals
Breakout
Reversal
Trend strength
Level touch
Level break

Discussion

Customer reviews

0.0
Reviews: 0
Customer reviews
No reviews for this product yet. Already tried it? Be the first to tell others!

FAQ

ADX
EMA
Key Levels
ATR
Moving Average
Products available through cTrader Store, including trading bots, indicators and plugins, are provided by third-party developers and made available for informational and technical access purposes only. cTrader Store is not a broker and does not provide investment advice, personal recommendations or any guarantee of future performance.

More from this author

cBot
ATR
Forex
+5
5 trend-following strategies, one powerful risk engine. Built for disciplined H4 swing trading.
3.12
Profit factor

You may also like

Indicator
Auto-detect supply & demand zones, remove broken levels, and trade smarter with real-time alerts. Precision made simple.
Indicator
Market Sessions
Indicator
Grid
Prop
+5
This technical analysis indicator provides information on market sentiment, trend and price levels....
Indicator
AI-assisted
Predictive Monte Carlo Engine Forecast future price paths using institutional-grade statistical models and probability
Indicator
ADX
ATR
+5
Configure, simulate, and analyze trading strategies with custom filters, multi-target exits, and detailed performance me
Indicator
BOS
MSS
+3
Orderblocks with Multi-Timeframe.
Indicator
BOS
EMA
+5
Market structure signals graded A to C, each with a drawn trade plan, plus an adaptive trend ribbon and a trend matrix
Indicator
Doji
Wedge
+5
Angora Pattern Recognition is a cTrader indicator that finds, draws and tracks classic chart patterns automatically.
Indicator
SMC
Forex
+5
ICT liquidity engine for Gold: maps stop clusters, scores zones & projects the next target. Now with 4 ICT killzones.
Indicator
Signal
New Trend whit buy-sell signal
Indicator
ATR
RSI
+8
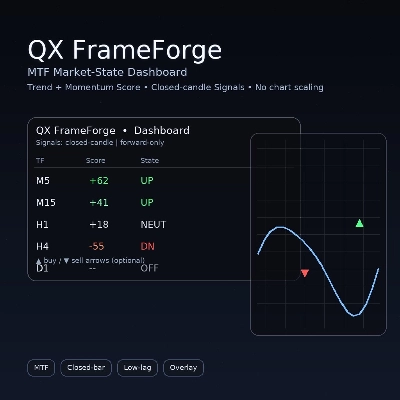
Multi-timeframe market-state dashboard: Score (-100..+100) + UP/NEUT/DN per TF, with optional closed-candle arrows.
Indicator
Track VWAP for Asia, London, NY, Sydney, Daily, Weekly, Monthly & Custom Sessions. Perfect for FX & intraday trading!
Indicator
Volume
Imbalance
+1
Volume profile indicator that auto-detects the latest trendline. Shows POC, Value Area (VAH/VAL), and High Volume Nodes
Indicator
Doji
Engulfing
+1
Mide en puntos la distancia entre el MΓ‘ximo y el MΓ­nimo alcanzados por cada vela, incluida la vela actual.
Indicator
Prop
Forex
+11
Inside Candle PRO - Professional Inside Bar Pattern Detector
Indicator
ATR
SMC
+19
Smart Liquidity Sweep detector with auto-drawing True Channels and real market structure mapping.
Indicator
Imbalance
Key Levels
+5
Smart Money Concepts (SMC) indicator with real-time Fair Value Gap (FVG) boxes, $50 round numbers, and live market HUD.
Indicator
ATR
RSI
+5
Multi-timeframe trend indicator using EMA, MACD & ADX to confirm high-probability buy and sell bias.

Price

Since 19/12/2025
734.58K
Traded volume
58.42K
Pips won