

الوصف
# 🚀 مؤشر الانزلاق الحركي (KSI) – أداة متقدمة لتحليل ضغط السوق والسيولة
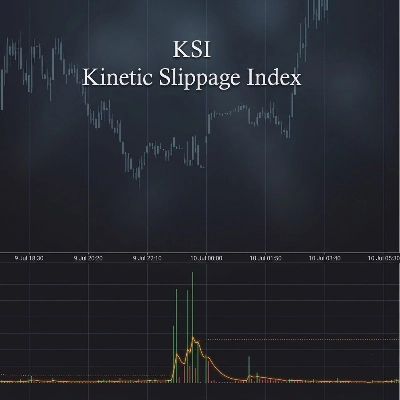
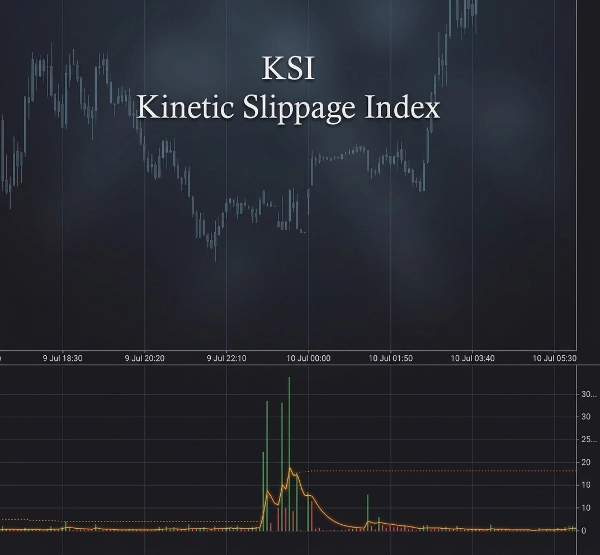
افتح رؤى أعمق للسوق مع **مؤشر الانزلاق الحركي (KSI)** — مؤشر تداول قوي مصمم لتحديد حركة السعر غير العادية، وعدم توازن الحجم، والأحداث المحتملة للسيولة قبل أن تصبح واضحة على الرسم البياني.
مصمم للمتداولين الذين يحللون **هيكل السوق، سلوك الحجم، التقلب، والنشاط المؤسسي**، يجمع KSI بين توسع النطاق وديناميكيات الحجم لقياس ظروف السوق غير الطبيعية.
## 🔥 الميزات الرئيسية
✅ **حساب مؤشر الانزلاق الحركي**
* يقيس العلاقة بين حركة السعر والحجم المتداول.
* يكتشف الحالات التي يتحرك فيها السعر بشكل غير متناسب مقارنة بسلوك الحجم الطبيعي.
* يساعد في تحديد ضغوط السيولة المحتملة، النشاط السوقي العدواني، والزخم غير العادي.
✅ **كشف القمم التكيفية**
* يحسب تلقائيًا مستويات القمم الديناميكية بناءً على سلوك السوق الأخير.
* يستخدم تحليل الانحراف الإحصائي لتسليط الضوء على الأحداث السوقية القصوى.
* يتكيف مع ظروف التقلب المتغيرة دون الحاجة إلى تعديلات يدوية مستمرة.
✅ **تنبيهات القمم في الوقت الحقيقي 🚨**
* استلم إشعارات عند حدوث تباعد غير طبيعي في الحجم/النطاق.
* يساعد المتداولين على التعرف بسرعة على ظروف الاختراق المحتملة، الاستحواذ على السيولة، أو ضغط السوق المفاجئ.
✅ **تحليل الحجم والتدفق 📊**
* يتتبع الحجم الحالي مقارنة بمتوسط EMA الخاص به.
* يبرز عندما يكون نشاط التداول مرتفعًا بشكل غير عادي.
* يشمل تحليل دلتا التراكمية لتصور ضغط الشراء والبيع.
✅ **تأكيد خط الإشارة 📈**
* حساب إشارة ناعمة يساعد في تحديد التغيرات في زخم KSI.
* تصور المدرج التكراري الأخضر/الأحمر يجعل تحولات ضغط السوق سهلة القراءة.
## 🕒 ذكاء جلسة التداول
يشمل KSI تتبع جلسات السوق تلقائيًا:
🌏 جلسة آسيا
🇬🇧 جلسة لندن
🇺🇸 نيويورك صباحًا
☕ غداء نيويورك
🌆 نيويورك مساءً
تساعد شاشة منطقة القتل المدمجة المتداولين على فهم متى تكون السيولة والتقلبات عادة أعلى.
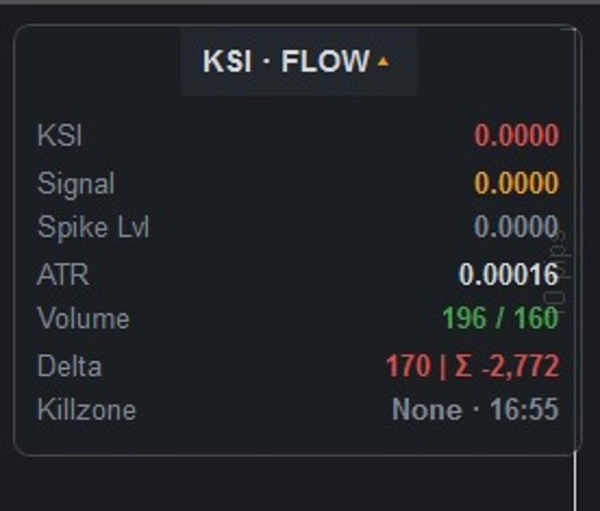
## 📌 لوحة المعلومات المهنية
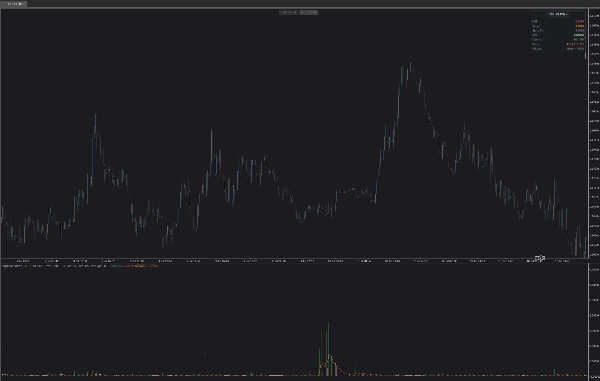
توفر لوحة التحكم المدمجة نظرة عامة نظيفة مباشرة على الرسم البياني الخاص بك:
📍 قيمة KSI الحالية
📍 مستوى الإشارة
📍 عتبة القمم التكيفية
📍 قراءة تقلب ATR
📍 الحجم الحالي مقابل متوسط الحجم
📍 دلتا والدلتا التراكمية
📍 جلسة التداول النشطة / منطقة القتل
يمكن أن تكون اللوحة:
* ✅ موضوعة في أي زاوية من الرسم البياني
* ✅ مصغرة أو موسعة
* ✅ قابلة للتعديل مع شفافية مخصصة
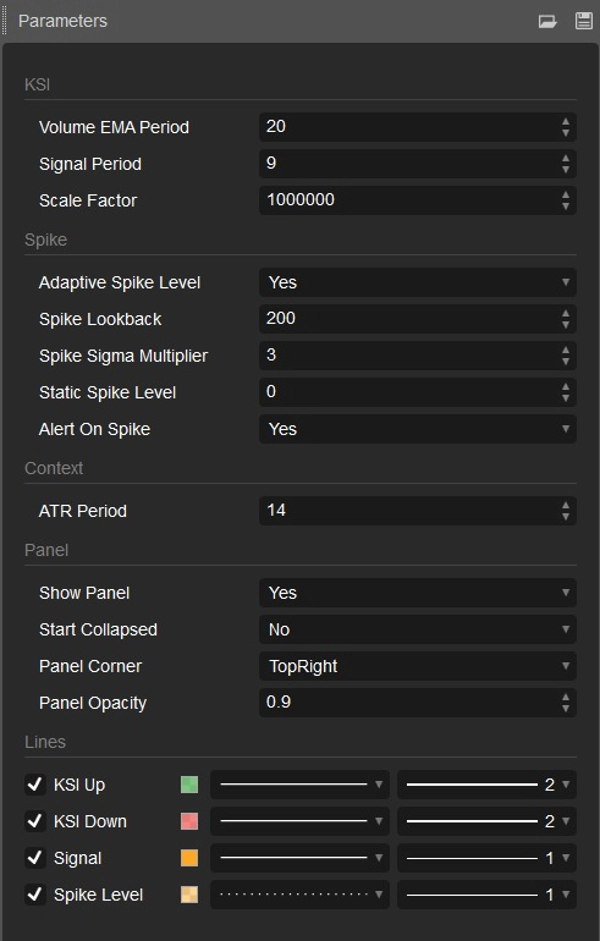
## ⚙️ إعدادات قابلة للتخصيص
اضبط KSI لأي نمط تداول:
🔧 فترة EMA للحجم
🔧 فترة الإشارة
🔧 عامل المقياس
🔧 كشف القمم التكيفية أو الثابتة
🔧 فترة النظر إلى الوراء للقمم
🔧 مضاعف حساسية القمم
🔧 فترة ATR
🔧 إعدادات مظهر اللوحة
## 🎯 مصمم لـ
✔ متداولي الفوركس
✔ متداولي العقود الآجلة
✔ متداولي العملات الرقمية
✔ المتداولين السريعين (سكالبيرز)
✔ متداولي اليوم
✔ محللي هيكل السوق
✔ المتداولين الباحثين عن تأكيد قائم على الحجم
## 💡 كيف يستخدم المتداولون KSI
يمكن لـ KSI المساعدة في تحديد:
⚡ نشاط السوق غير العادي
⚡ ضغط الاختراق المحتمل
⚡ تباعد السعر والحجم
⚡ أحداث السيولة
⚡ تغيرات الزخم
⚡ فرص التداول عالية التقلب
ادمج KSI مع استراتيجيتك الحالية للحصول على رؤية أوضح **متى يتحرك السوق بشكل طبيعي — ومتى يحدث شيء غير عادي.**
📈 تداول بذكاء. افهم ضغط السوق. اكتشف النشاط الخفي مع مؤشر الانزلاق الحركي.
الملخص
The indicator includes volume and flow analysis by comparing current volume to its exponential moving average (EMA) and incorporates cumulative delta analysis to visualize buying and selling pressure. A smooth signal line and histogram help confirm changes in KSI momentum, making shifts in market pressure easier to interpret.
KSI tracks major trading sessions—Asia, London, and New York (AM, Lunch, PM)—highlighting periods of higher liquidity and volatility. A professional information panel displays key metrics such as current KSI value, signal level, adaptive spike threshold, ATR volatility, volume comparisons, delta values, and active trading sessions. This panel is customizable in position, size, and opacity.
Settings allow fine-tuning of volume EMA period, signal period, scale factor, spike detection parameters, ATR period, and panel appearance. KSI is suitable for forex, futures, and crypto traders, including scalpers, day traders, and market structure analysts seeking volume-based confirmation and insights into unusual market activity, breakout pressure, liquidity events, and momentum changes.
مناقشة
تقييمات العملاء
5 | 0 % | |
4 | 100 % | |
3 | 0 % | |
2 | 0 % | |
1 | 0 % |
الأسئلة الشائعة
المزيد من هذا المؤلف
















السعر