


Descrizione
Cosa fa
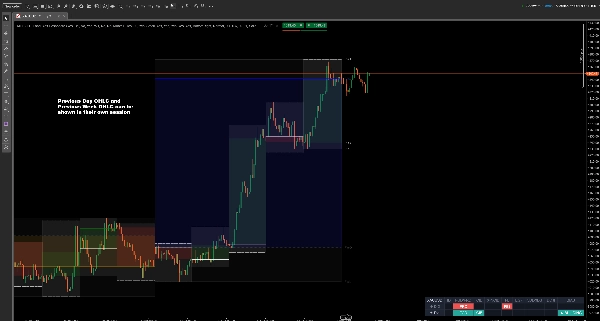
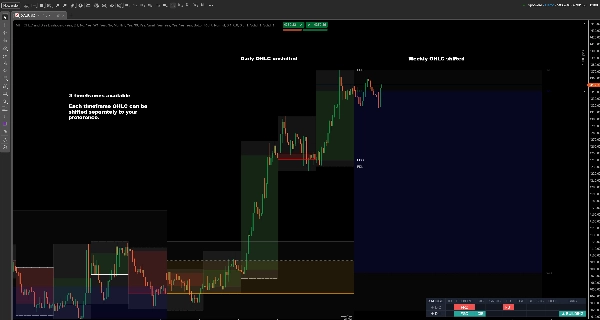
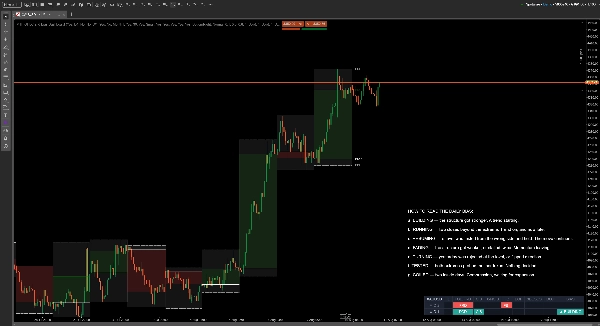
MULTI-TIMEFRAME OHLC e BIAS DASHBOARD è un indicatore di price action multi-timeframe per cTrader. Disegna i livelli OHLC del giorno precedente, della settimana precedente e del mese precedente — apertura, massimo, minimo e chiusura — sul tuo grafico, e aggiunge una dashboard che legge cosa ha effettivamente fatto il prezzo a quei livelli negli ultimi due giorni completati.
Massimo e minimo del giorno precedente (PDH e PDL), apertura giornaliera, massimo e minimo settimanale: questi sono i livelli di supporto e resistenza di timeframe superiori da cui la maggior parte dei trader intraday e swing già lavora. Quello che di solito fanno a occhio ogni mattina è confrontarli — ieri ha chiuso sopra il giorno prima? Il prezzo ha superato il massimo del giorno precedente e ha fallito? Il movimento si sta costruendo o sta esaurendo spazio? Questo indicatore risponde a queste domande sul grafico, in una sola riga.
Livelli OHLC multi-timeframe
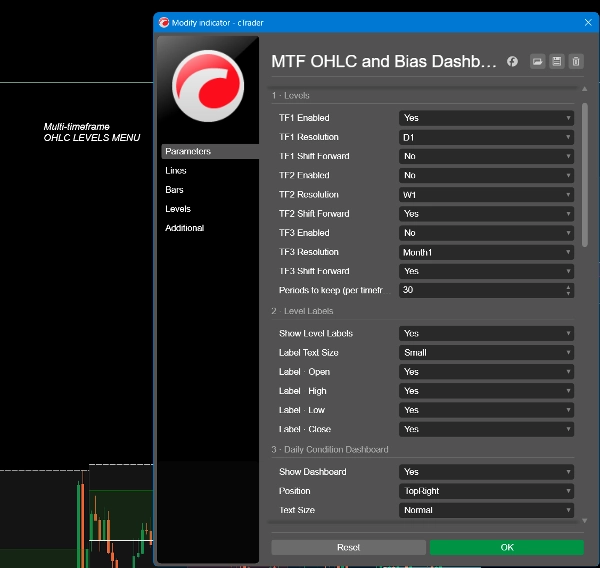
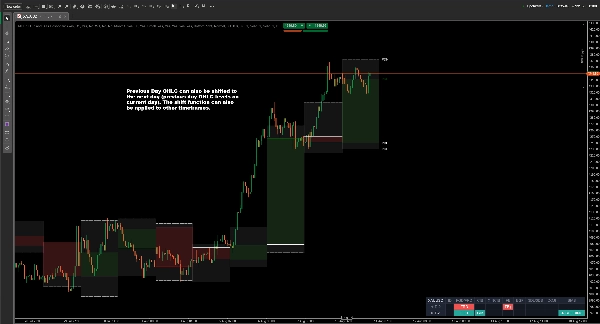
Fino a tre timeframe contemporaneamente — giornaliero, settimanale, mensile, o qualsiasi risoluzione tu scelga. Ognuno disegna apertura, massimo, minimo e chiusura, con un corpo ombreggiato opzionale e una banda dal massimo al minimo. I livelli possono essere spostati in avanti così che il riferimento del periodo corrente si trovi davanti al prezzo anziché dietro, e puoi mantenere fino a 70 periodi storici sul grafico.
Ogni linea ha il proprio colore, spessore e stile, così un livello di supporto settimanale non viene mai confuso con uno giornaliero.
La dashboard della condizione giornaliera
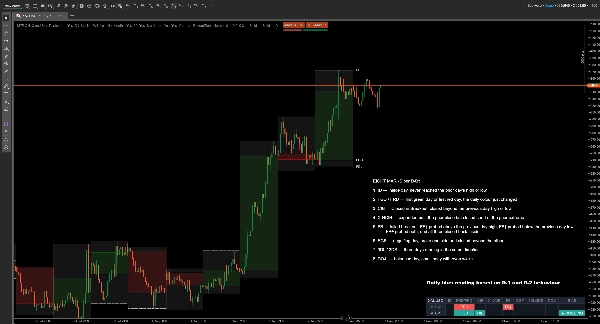
La dashboard valuta le ultime due candele giornaliere completate — D-1 (ieri) e D-2 (il giorno prima) — ciascuna rispetto al giorno che l'ha preceduta.
Nove segnali per giorno:
- ID — inside day, non ha mai raggiunto il massimo o minimo del giorno precedente
- FGD / FRD — primo giorno verde o primo giorno rosso, il colore giornaliero è appena cambiato (Verde è giorno rialzista e Rosso è giorno ribassista)
- CIB — Chiuso in Breakout, chiuso oltre il massimo o minimo del giorno precedente
- X-NCIB — si è esteso oltre la chiusura precedente ma ha chiuso prima dell'estremo precedente (Expand Not Closed In Breakout = X-NCIB)
- FB — breakout fallito: FB↑ ha sondato sopra il massimo del giorno precedente, FB↓ ha sondato sotto il minimo del giorno precedente, FB± ha sondato entrambi, e tutti e tre hanno chiuso di nuovo all'interno
- EGF — giorno engulfing, ha rotto un lato e chiuso oltre l'altro
- 3DL / 3DS — tre giorni consecutivi nella stessa direzione (3 Giorni Long = 3DL / 3 Giorni Short = 3DS)
- DOJI — giorno equilibrato, corpo piccolo con ombre simmetriche
- BIAS — la lettura, spiegata sotto
Come leggere il bias giornaliero
Il bias è la parte che ti fa risparmiare lavoro. Ogni giorno si riduce a uno stato singolo, e il bias deriva dal movimento tra D-2 e D-1 — non solo da ieri. Lo stesso segnale significa cose diverse a seconda di cosa lo ha preceduto, e questo è esattamente ciò che una dashboard di un solo giorno non può dirti.
- BUILDING — la struttura si è rafforzata. Una tendenza sta iniziando.
- RUNNING — due chiusure oltre l'estremo. Tendenza in corso, e ora in ritardo.
- RESUMING — un livello è stato testato dal lato sbagliato e ha tenuto. Il movimento continua.
- FADING — la struttura si è indebolita, o si è fermata due volte. Momentum in uscita.
- TURNING — ieri è stato respinto al livello, o ha invertito direzione.
- TESTED — entrambi gli estremi sondati, nessuno preso. Nulla deciso.
- COILED — due inside day. Compressione, in attesa di espansione.
Una freccia e un colore indicano la direzione: verde verso l'alto per rialzista, rosso verso il basso per ribassista, grigio neutro quando non c'è direzione da indicare.
Entrambe le righe di dettaglio rimangono visibili sopra il bias, così puoi sempre vedere perché legge in quel modo invece di affidarti a una scatola nera.
Uso tipico
Apri il grafico al mattino, leggi il bias e sai prima che inizi la sessione se stai cercando una continuazione, un calo o un intervallo. Poi fai trading con le tue configurazioni contro i livelli disegnati — il massimo e minimo del giorno precedente, l'apertura giornaliera, gli estremi settimanali.
Si adatta al lavoro sull'apertura del range, al trading su breakout falliti e alle strategie di continuazione giorno per giorno. Utile su forex, indici, metalli e crypto.
Impostazioni
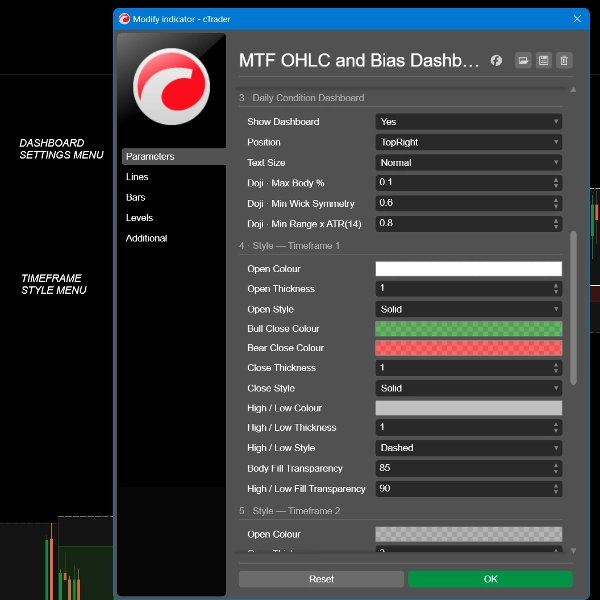
- Tre slot di timeframe indipendenti, ciascuno con la propria risoluzione, toggle di spostamento in avanti e controlli completi di colore, spessore e stile
- Numero di periodi storici da mantenere, fino a 70
- Etichette dei livelli attivabili o disattivabili, per tipo di linea, con dimensione del testo regolabile
- Dashboard attivabile o disattivabile, cinque posizioni sullo schermo, quattro dimensioni del testo
- Sensibilità Doji: percentuale massima del corpo, simmetria minima delle ombre, intervallo minimo rispetto alla media a 14 giorni
******************************************************
Per chi è
Trader intraday e swing che già lavorano con i livelli del giorno precedente e della settimana precedente. Presuppone che tu sappia cos'è un massimo del giorno precedente e perché è importante. Se quei livelli non fanno già parte del tuo modo di fare trading, questo non ti insegnerà a usarli.
Cosa non fa
Essere chiari su questo ora ci fa risparmiare tempo entrambi dopo:
- Non fornisce segnali di acquisto o vendita, né prezzi di entrata o uscita
- Non piazza ordini e non può toccare il tuo conto — l'indicatore funziona senza alcun diritto di accesso
- Non ha allarmi o notifiche
- Non predice nulla. Ogni segnale descrive candele già chiuse
- Non ridipinge. La dashboard legge solo candele giornaliere completate, quindi una lettura non cambia mai a posteriori
- Non è una strategia. Il bias descrive la struttura; non raccomanda un trade
********************************************************
Cose da sapere
La dashboard necessita di almeno quattro candele giornaliere completate, quindi un simbolo appena quotato mostrerà trattini finché non avrà abbastanza storia.
Le candele giornaliere iniziano all'orario del server del tuo broker. Due broker sullo stesso strumento possono tagliare il giorno a ore diverse, il che significa che lo stesso simbolo può legittimamente leggere diversamente su due piattaforme. Questa è una proprietà dei dati, non un difetto dell'indicatore.
Al di sopra del timeframe giornaliero la dashboard non può leggere dati giornalieri e mostra un avviso TF > D. I livelli vengono comunque disegnati.
Il trading comporta rischi. Le performance passate non garantiscono risultati futuri.
Riepilogo
A central feature is the two-day price action bias dashboard, which analyzes the last two completed daily candles relative to their preceding days. It categorizes daily price behavior into nine distinct patterns (e.g., inside day, first green/red day, failed breakout, engulfing day) and summarizes the overall bias into states such as building, running, fading, or turning. Directional bias is indicated with colored arrows (green for bullish, red for bearish, grey for neutral), helping traders quickly assess market structure without guesswork.
Designed for intraday and swing traders familiar with previous day and week levels, the indicator does not provide trade signals, alerts, or order execution. It is suitable for forex, indices, metals, and cryptocurrencies, aiding strategies like opening-range, failed-breakout, and continuation trading by clearly marking key levels and daily price action context.
Discussioni
Recensioni dei clienti
Domande frequenti
Altro da questo autore




















Prezzo