

الوصف
حزمة الاستراتيجية التوافقية برو
معظم المؤشرات التوافقية ترسم نمطًا وتتركك تتساءل عما إذا كان
يستحق التداول. هذا المؤشر يجيب على هذا السؤال: كل نمط يجده يتم
إعادة تشغيله مقابل تاريخ الرسم البياني نفسه، لذا ترى معدل النجاح الحقيقي لكل
نوع نمط على الأداة والإطار الزمني أمامك - قبل أن تخاطر
بأي شيء.
ما يحلله
يعمل المؤشر فقط من هيكل السعر - لا مؤشرات مضافة على
مؤشرات، ولا يعيد رسم الأنماط المؤكدة.
محرك محور أصلي يجتاز الرسم البياني عبر مجموعة كاملة من أعماق التأرجح
مرة واحدة، لذا يلتقط الهياكل على عدة مقاييس بدلاً من المقياس الوحيد
الذي تفضله إعداداتك. يتم دمج المحاور المتتالية في نفس الاتجاه إلى
الحد الأقصى الحقيقي، مما يعطي تسلسلًا نظيفًا بالتناوب عالي-منخفض-عالي.
كل نافذة مكونة من خمسة محاور متتالية (X-A-B-C-D) تُقاس بعد ذلك مقابل
تعريفات فيبوناتشي المنشورة لستة أنماط توافقية كلاسيكية:
جارتلي B عند 0.618 من XA، D عند 0.786
بات B عند 0.382-0.50، D عند 0.886
بفراشة B عند 0.786، D عند 1.272-1.618
سلطعون B عند 0.382-0.618، D عند 1.618
قرش B عند 1.13-1.618، D عند 0.886-1.13
سايفر B عند 0.382-0.618، C عند 1.272-1.414، D عند 0.786
إعداد التسامح يتحكم في مدى صرامة تحقيق تلك النسب، ويتم تقييم كل
كشف من 0-100 بناءً على مدى قربه من النسبة المثالية - لذا يتم تمييز
جارتلي النموذجي بوضوح عن الجارتلي الفضفاض.
المختبر الخلفي - ما الذي يجعل هذا مختلفًا
هذا هو الجزء الذي لا تمتلكه معظم أدوات التوافق.
لكل نمط يتم العثور عليه، يحاكي المؤشر الصفقة التي كان ذلك النمط
سينتجها:
- يتم وضع أمر حد عند نقطة إكمال D.
- إذا وصل السعر إلى الهدف أو وقف الخسارة قبل لمس D، يتم
اعتبار الإعداد ملغى ولا يتحول إلى صفقة - تمامًا كما يتم إلغاء
أمر معلق حقيقي.
- تنتهي صلاحية الأوامر غير المعبأة بعد 15 شريطًا.
- يتم متابعة الصفقات المعبأة شريطًا بشريط لمعرفة ما إذا كانت وصلت
إلى الهدف 1، الهدف 2، أو الوقف أولاً.
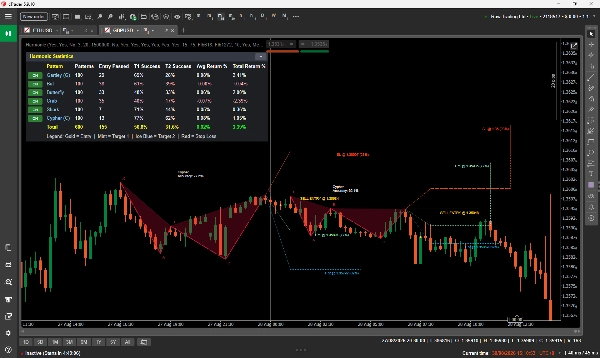
تُجمع تلك النتائج في لوحة معلومات على الرسم البياني تظهر، لكل نوع نمط:
الأنماط المكتشفة | الإدخالات المعبأة | معدل الوصول للهدف 1 | معدل الوصول للهدف 2 |
العائد المتوسط | العائد الكلي
مع صف إجمالي مدمج. يتم تمييز الصفوف الخاسرة، ولكل نوع نمط
زر تشغيل/إيقاف يقوم على الفور بتصفية النمط من الرسم البياني. تنكمش اللوحة
إلى شريط عنوان واحد عندما تريد رؤية واضحة.
يمكنك أن ترى بنظرة سريعة، على سبيل المثال، أن سايفر نادرًا ما يملأ لكنه يتحول
غالبًا على هذه الزوجة، بينما يملأ سلطعون أكثر ويتحول أقل. هذا حكم يمكنك
التصرف بناءً عليه - ويتم قياسه على بيانات وسيطك، وليس مقتبسًا من كتاب.
كيفية قراءة الرسم البياني
يتم رسم كل نمط كهيكل عظمي X-A-B-C-D مع مثلثات مظللة. التظليل ليس زخرفيًا:
كلما وصل ذلك النوع من النمط إلى الهدف 1 في الاختبار الخلفي أكثر، كان تعبئته
أكثر صلابة، لذا تبرز الهياكل الموثوقة فورًا.
يحمل كل نمط خطة التداول الكاملة الخاصة به:
خط الدخول الذهبي، معنون BUY ENTRY / SELL ENTRY بالسعر الدقيق
الهدف 1 باللون النعناعي، معنون بالسعر ومعدل الوصول T1 لذلك النمط
الهدف 2 باللون الأزرق الثلجي، نفس المعالجة
وقف الخسارة الأحمر
أسلوب الخط يخبرك بما حدث. المستوى الذي وصل إليه السعر فعليًا مرسوم
بخط صلب ويتوقف عند الشريط الذي تم الوصول إليه. المستوى الذي لم يتم الوصول إليه
يبقى منقطًا ويمتد حتى نهاية الإعداد. نقطة ذهبية تحدد شريط التأكيد. تقع التسميات
في نهاية خطها الخاص، مع رسم خط توجيهي كلما كان يجب دفعها لتبقى مقروءة.
يتم طباعة اسم النمط والدقة بجانب كل هيكل، موضوعة أسفل الإعدادات الصاعدة
وفوق الإعدادات الهابطة بحيث لا تجلس أبدًا على حركة السعر.
الإعدادات الرئيسية
تضمين أنماط صاعدة / هابطة فلتر اتجاه التداول
تفعيل جارتلي ... تفعيل سايفر إيقاف تشغيل الأنماط الفردية بالكامل
محدد المحور الحد الأدنى / الأقصى نطاق حساسية التأرجح (3-20).
الحد الأدنى الأعلى يجد هياكل أقل وأكبر
مسموح نسبة خطأ فيبوناتشي % تسامح النسبة. 15% هو الافتراضي المتوازن؛
خفضه للكشف عن الأنماط النموذجية فقط
مسافة وقف الخسارة وضع الوقف بعد D، كنسبة مئوية من نطاق AD
الهدف 1 / الهدف 2 نسبة مضاعفات فيبوناتشي لـ AD
أشرطة تاريخية للمسح عمق المسح وبالتالي عينة الإحصائيات
الحد الأقصى للأنماط للرسم وضوح الرسم البياني مقابل الاكتمال
عرض لوحة الإحصائيات تشغيل/إيقاف لوحة المعلومات
الألوان وحجم الخط تحكم بصري كامل
لمن هو
مناسب للمتداولين الذين يفهمون بالفعل الأنماط التوافقية ويريدون
أتمتة العمل الشاق مع إرفاق الأدلة - وللمتداولين المتوسطين الذين
يعرفون الأشكال لكنهم غير متأكدين من أيها يثقون به.
إنه مفيد حقًا لمتداولي التأرجح واليوم على أي أداة وأي
إطار زمني: الفوركس، المؤشرات، السلع والعملات المشفرة كلها تعمل، لأن المنطق
هو هندسة سعرية بحتة.
إذا لم تقابل نمطًا توافقياً من قبل، اقرأ الأساسيات أولاً.
سيجدها المؤشر لك، لكنه يفترض أنك تعرف ما يحاول جارتلي
إخبارك به.
الاستخدام النموذجي
1. اربطه برسم بياني ودع لوحة المعلومات تبني عينتها.
2. انظر إلى أنواع الأنماط التي تؤدي فعليًا على تلك الأداة و
الإطار الزمني، وأوقف الأنماط الضعيفة.
3. انتظر إكمالًا جديدًا عند D، مع التحقق من درجة الدقة ومعدل النجاح التاريخي
لذلك النوع.
4. استخدم الدخول المرسوم، والوقف، والأهداف كخطة، مع تحديد الحجم حسب مخاطرتك.
ملاحظات مهمة - يرجى القراءة
- هذه أداة تحليل. لا تضع أو تعدل أو تغلق أي أمر.
لا يوجد تداول آلي ولا تمس حسابك أبدًا.
- الأداء السابق ليس تنبؤًا. تعرض لوحة المعلومات ما قامت به هذه
الأنماط تاريخيًا على البيانات المحملة. إنها دليل لاتخاذ قرار، وليس ضمانًا للصفقة التالية.
- الإحصائيات تحتاج إلى عينة. يعطي cTrader المؤشر فقط الأشرطة التي
تم تحميلها فعليًا على الرسم البياني، لذا قم بالتمرير للخلف لتحميل التاريخ قبل الحكم
على الأرقام - الفرق بين بضع مئات من الأشرطة وآلاف عدة هو الفرق بين الضوضاء وعينة قابلة للاستخدام.
- تُعرض العوائد كنسبة مئوية من السعر. ستُظهر زوج فوركس نسبًا أصغر
طبيعيًا مقارنة بمؤشر أو سلعة؛ قارن المماثل بالمماثل.
- معدلات ملء الدخول منخفضة واقعيًا حسب التصميم. العديد من إعدادات التوافق
لا تملأ أبدًا لأن السعر يبتعد عن D أولاً. يحسب المؤشر ذلك بأمانة كغير معبأة بدلاً من تزيين الإحصائيات.
- عمليات المسح العميقة تقوم بعمل حقيقي. إذا رفعت عدد الأشرطة عاليًا على جهاز بطيء
ورأيت توقفًا عند كل شريط جديد، قلل عدد الأشرطة التاريخية للمسح أو ارفع
الحد الأدنى لعمق المحور.
تحليل فقط. لا ملفات DLL. لا اتصالات خارجية. لا يرسل أو يعدل أو
يغلق أمرًا.
الملخص
A key feature is its integrated backtester, which simulates trades for each pattern found on the chart’s historical data. It places hypothetical limit orders at pattern completion points (D), tracks whether targets or stops are hit, and accounts for unfilled orders and invalidated setups. Results are summarized in an on-chart dashboard showing statistics such as patterns found, entries filled, hit rates for two targets, average and total returns per pattern type, with options to filter patterns on or off.
Patterns are visually displayed with their X-A-B-C-D structure, trade entry, stop loss, and target levels, using line styles and shading to indicate historical success rates and trade outcomes. The indicator supports customization of pattern inclusion, pivot sensitivity, Fibonacci ratio tolerance, stop and target distances, and visual settings.
Designed for traders familiar with harmonic patterns, it suits swing and intraday trading across instruments and timeframes including forex, indices, commodities, and crypto. It functions solely as an analysis tool without order execution capabilities.

















