

الوصف
🚀 أداة رسم مناطق HF من EGO: مناطق سريعة كالصاعقة، دقيقة حتى البكسل
هل سئمت من المعاناة مع أدوات الرسم البياني الأصلية؟ هل تقضي وقتًا طويلاً في سحب المستطيلات يدويًا بدلاً من تحليل السوق فعليًا؟ تعرف على ميزتك الجديدة غير العادلة.
أداة رسم مناطق HF من EGO هي أداة مميزة تعتمد على مفاتيح الاختصار مصممة لأتمتة وتسريع روتين ترميز الرسم البياني الخاص بك بالكامل. ارسم، حرر، وأدر مناطق التداول الخاصة بك بدون أي احتكاك وبدقة رياضية.
📊 بيانات السوق التي تحللها
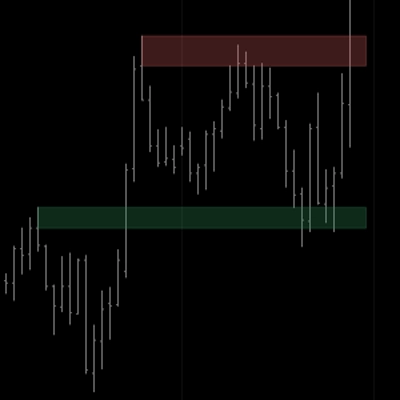
هذه ليست أداة رسم أساسية. يقوم المؤشر بتحليل بيانات الشمعدان OHLC (الفتح، الأعلى، الأدنى، الإغلاق) في الوقت الحقيقي فورًا حيثما يكون مؤشر الماوس. يحسب الفارق الدقيق بين جسم الشمعة والفتيل، وينشئ تلقائيًا منطقة دقيقة حتى البكسل تتماشى تمامًا مع بيانات السوق. لا حاجة للتكبير لإصلاح الحواف المهملة بعد الآن!
🎨 تفسير الإشارات والمرئيات
تقوم الأداة بأتمتة ترميز الألوان بالكامل. بناءً على اتجاه الشمعة الأساسية، تعين فورًا صعودي (مثل الطلب / الدعم) أو هبوطي (مثل العرض / المقاومة) كموضوع لوني.
- المنطقة الخضراء/الصعودية: تُرسم تلقائيًا على الشموع الصعودية.
- المنطقة الحمراء/الهبوطية: تُرسم تلقائيًا على الشموع الهبوطية. هل تحتاج إلى قلب الانحياز؟ نقرتان مزدوجتان بسيطتان على المنطقة تبدل لونها فورًا.
⚙️ الإعدادات الرئيسية ومفاتيح الاختصار (السحر)
السرعة هي كل شيء. لقد استبدلنا القوائم المملة بمجموعات لوحة مفاتيح وفأرة بديهية:
- نقرة مزدوجة أو Shift + نقرة (على مساحة فارغة): إنشاء منطقة جديدة فورًا متطابقة تمامًا مع الشمعة تحت مؤشر الماوس.
- نقرة مزدوجة (على منطقة): تبديل لون المنطقة (صعودي ↔ هبوطي).
- Alt + نقرة (على منطقة): تمديد المنطقة فورًا إلى المستقبل بعدد القضبان المحددة مسبقًا.
- Ctrl + نقرة (على منطقة): إعادة تثبيت المنطقة بدقة على شمعتها الأصلية.
- Shift + نقرة (على منطقة): حذف المنطقة فورًا.
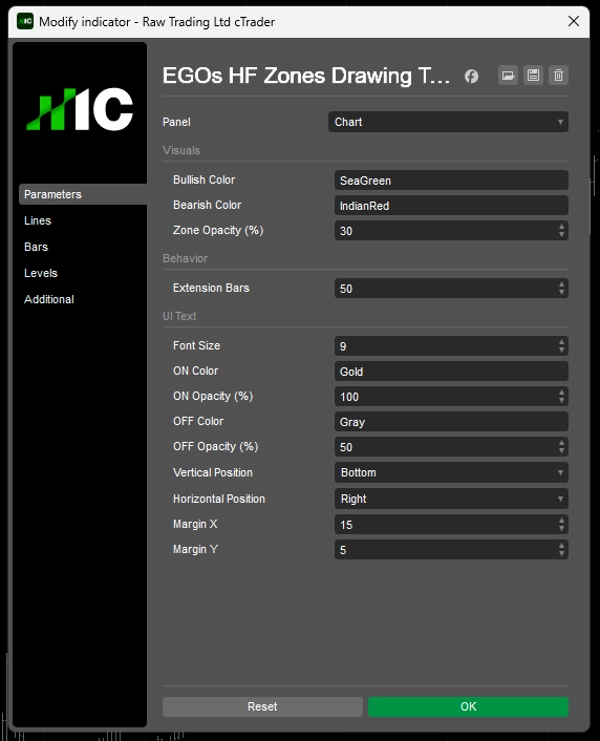
- التخصيص: ألوان قابلة للتعديل بالكامل، شفافية من 0-100%، وتحديد موضع نصي مخصص لواجهة المستخدم. اضغط 'H' على لوحة المفاتيح لتبديل ورقة غش أنيقة على الرسم البياني حتى لا تنسى أي اختصار!
🎯 حالات الاستخدام النموذجية وسيناريوهات التداول
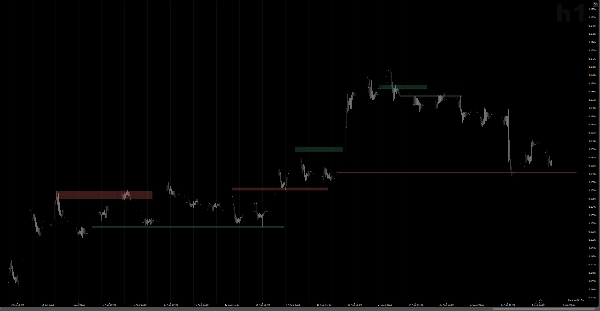
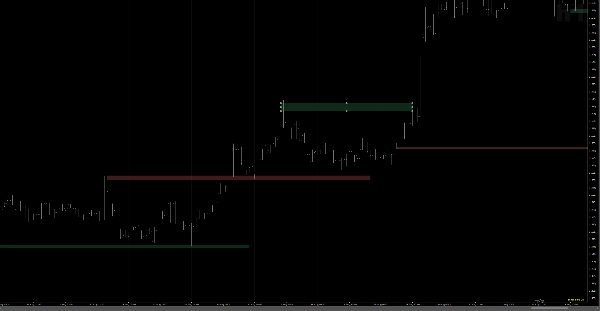
مصممة خصيصًا لـ التحليل من الأعلى إلى الأسفل. سواء كنت ترسم الاتجاهات الشهرية/الأسبوعية الكبرى أو تحسن مناطق التنفيذ على H1، تقلل هذه الأداة وقت ترميز الرسم البياني بنسبة 80%. إنها أفضل رفيق للرسم:
- مناطق العرض والطلب
- كتل الأوامر (OB) وفجوات القيمة العادلة (FVG)
- مستويات الدعم والمقاومة الرئيسية
- مناطق التقاء للدخول في اختراق أو ارتداد.
👤 لمن هذه الأداة؟
إذا كانت استراتيجيتك تعتمد على المناطق، فهذه أداة لا غنى عنها في مجموعة أدواتك.
- متداولو مفاهيم المال الذكي (SMC) وحركة السعر: الذين يحتاجون إلى كتل أوامر دقيقة جراحيًا.
- متداولو التأرجح والمراكز: الذين يديرون عدة رسوم بيانية وأطر زمنية ويرغبون في الحفاظ على مساحة عمل نظيفة وفعالة.
- مستوى الخبرة: من المبتدئين الذين يريدون رسومًا بيانية أنظف وخالية من الأخطاء، إلى المحترفين المخضرمين الذين يقدرون وقتهم ويطالبون بالكفاءة.
⚠️ ملاحظات مهمة وقيود
لضمان أداء سريع للغاية وتجنب التعارض مع خصائص النقر المزدوج الأصلية في cTrader، تعمل الأداة بميزة وضع التحرير الذكية.
- تحرير المناطق: إيقاف (افتراضي): المناطق مقفلة في مكانها. تعمل مفاتيح الاختصار الخاصة بك (تبديل اللون، التمديد، الحذف) فورًا دون تحريك المنطقة عن طريق الخطأ.
- تحرير المناطق: تشغيل (اضغط
Shift الأيمن): تصبح المناطق "غير مقفلة". يمكنك الآن استخدام وظائف cTrader الأصلية لسحب، تمديد، أو تحريك الزوايا يدويًا باستخدام الماوس.
توقف عن رسم المستطيلات يدويًا. قم بأتمتة روتينك، تخلص من أخطاء البكسل، وتداول بدقة مطلقة. احصل على أداة رسم مناطق HF من EGO اليوم!
الملخص
Key features include instant zone creation, resizing, extending, deleting, and re-snapping using intuitive keyboard and mouse shortcuts, eliminating manual rectangle drawing. Users can customize colors, opacity, and text positioning, with an on-chart shortcut reference available.
The tool supports top-down analysis across multiple timeframes, facilitating the marking of supply and demand zones, order blocks, fair value gaps, key support and resistance levels, and confluence zones for breakout or pullback entries. It is suitable for Smart Money Concepts and price action traders, swing and position traders, and users of all experience levels seeking precise, efficient chart markup.
An Edit Mode allows toggling between locked zones for quick hotkey actions and unlocked zones for manual adjustments using native chart functions. This indicator is optimized for cTrader and focuses on visual zone drawing based on bar data.








![شعار "[Hamster-Coder] Bollinger Bands"](https://cdn.ctrader.com/image/webp/21d8e5d6-fb11-4bac-b9ee-cd05c2b76804_30327)








