
TECHNISCHE ANALYSE, MIT TONALARM
Der TECHNISCHE ANALYSE-Indikator ist eine fortschrittliche technische Analyse-Lösung, die für die cAlgo-Plattform entwickelt wurde und mehrere technische Indikatoren integriert, die sich auf die Identifizierung robuster Trends, Marktimpulse und Volumenbestätigungen konzentrieren. Er kombiniert den ADX (Average Directional Index) mit Steigungsanalyse, Volumenfilterung und Echtzeit-Multi-Indikator-Technikanalyse und bietet Händlern eine umfassende und zuverlässige Sicht für die Entscheidungsfindung.
🔍 Hauptstrategie
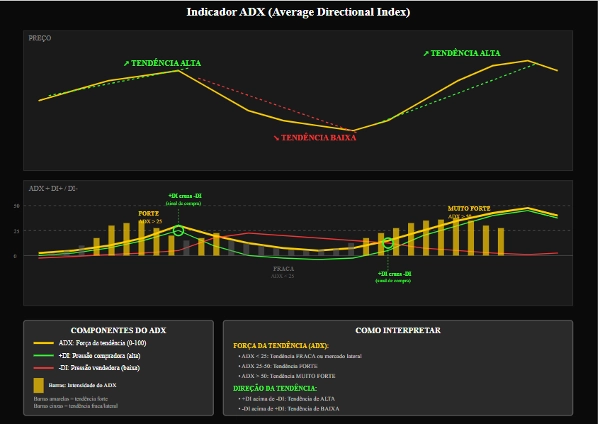
1. Basis: ADX + DI (Directional Movement System)
Der Kern des Indikators ist der ADX (Average Directional Index), der die Stärke des Trends misst.
Die Komponenten +DI (Positive Directional Indicator) und -DI (Negative Directional Indicator) identifizieren die Richtung des Trends:
+DI > -DI → Aufwärtstrend
-DI > +DI → Abwärtstrend
2. Dynamische Momentum-Analyse mit Steigung
Die Steigung von ADX, +DI und -DI wird mittels linearer Regression berechnet.
Dies ermöglicht die Identifizierung, ob der Trend:
an Stärke gewinnt (positive Steigung)
an Stärke verliert (negative Steigung)
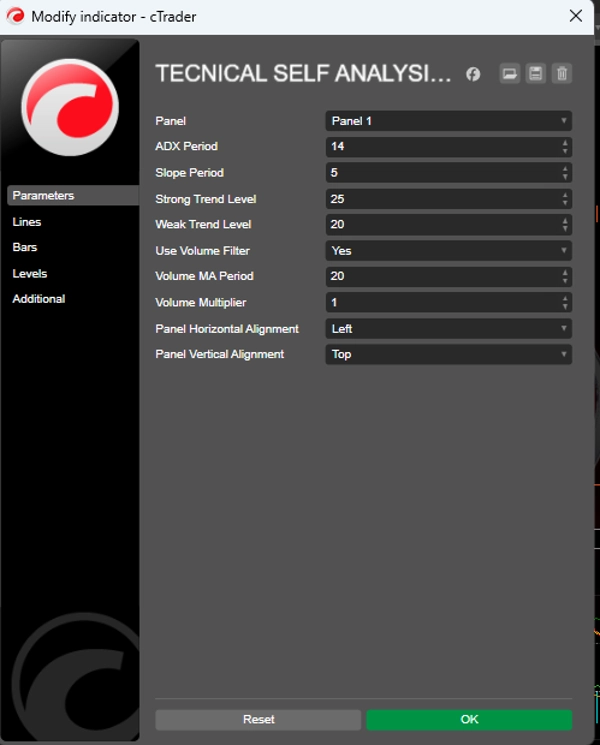
3. Referenzniveaus
Starkes Trendniveau: Niveau, über dem der Trend als stark gilt (Standard: 25)
Schwaches Trendniveau: Mindestniveau, um einen gültigen Trend zu betrachten (Standard: 20)
Trends unterhalb des schwachen Niveaus werden als Seitwärtsbewegung oder ohne klare Richtung behandelt.
📈 Signalgenerierung
Kaufbedingungen
✅ +DI kreuzt über -DI
✅ ADX über dem schwachen Trendniveau (Schwaches Trendniveau)
✅ Positive Steigungen von ADX und +DI
✅ Volumenbestätigung (optional)
Verkaufsbedingungen
✅ -DI kreuzt über +DI
✅ ADX über dem schwachen Trendniveau (Schwaches Trendniveau)
✅ Positive Steigungen von ADX und -DI
✅ Volumenbestätigung (optional)
Starke Signale: Wenn der ADX über dem starken Trendniveau liegt und die Steigungen deutlich positiv sind, erzeugt der Indikator verstärkte Signale und vermeidet aufeinanderfolgende wiederholte Einstiege. 📊 Volumenfilter (optional)
Der Indikator kann vor der Signalerzeugung eine Volumenbestätigung verlangen.
Das aktuelle Volumen muss größer oder gleich dem gleitenden Durchschnitt des Volumens × Multiplikator sein.
Dies hilft, falsche Ausbrüche und Signale in illiquiden Märkten herauszufiltern.
🧠 Fortgeschrittene technische Analyse (interaktives Panel)
TECHNISCHE ANALYSE enthält zwei interaktive Panels im Chart:
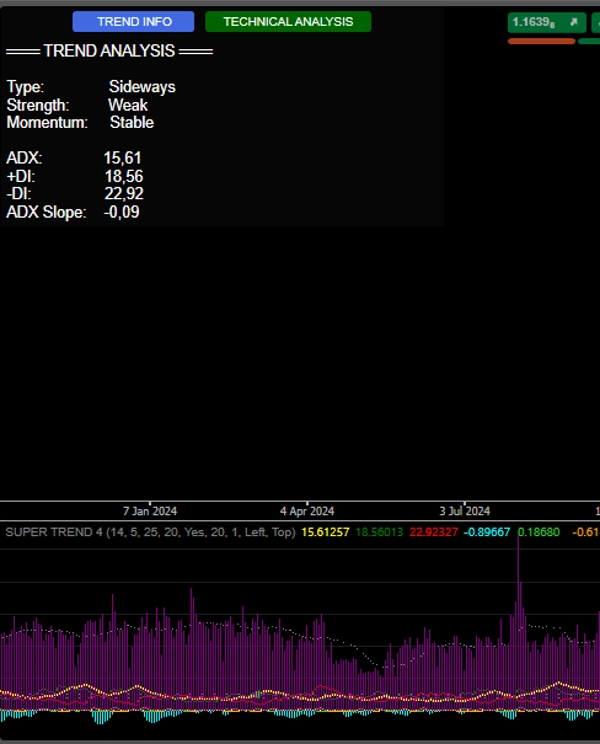
1. TREND INFO
Trendtyp: Aufwärtstrend / Abwärtstrend / Seitwärts
Trendstärke: Stark / Schwach
Momentum: Verstärkend / Abschwächend / Stabil
Aktuelle Werte von ADX, +DI, -DI und Steigung
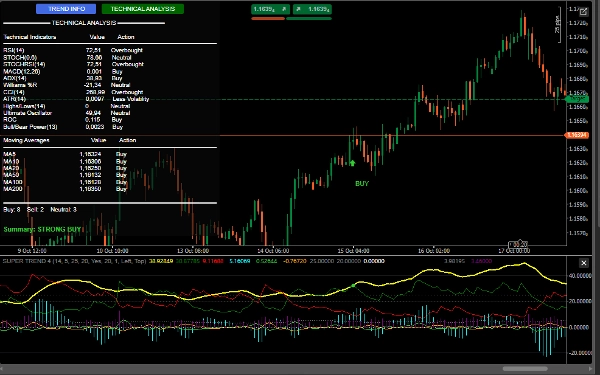
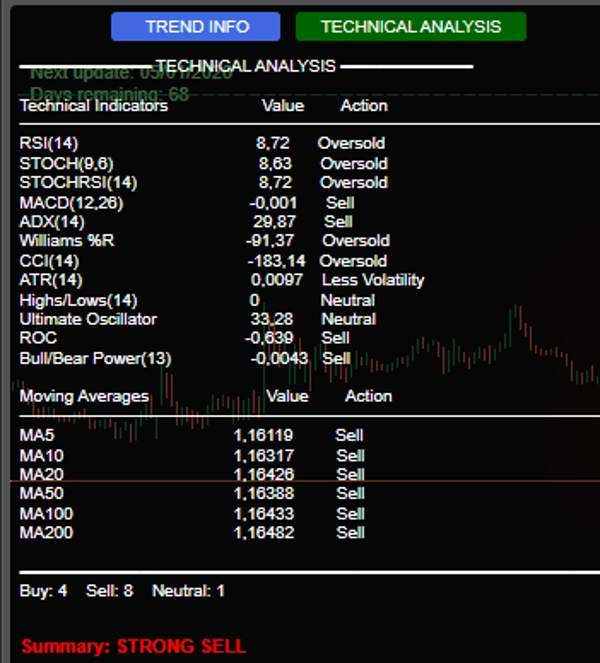
2. TECHNISCHE ANALYSE
Führt eine Echtzeit-Multi-Indikator-Analyse durch, einschließlich:
RSI(14) – Überkauft/Überverkauft
Stochastisch(14) – Momentum
MACD(12,26) – Kreuzungen und Divergenzen
Williams %R – Marktextrme
CCI(14) – Abweichungen vom typischen Preis
ROC(12) – Änderungsrate
Ultimate Oscillator – Bestätigung der Stärke
Bull/Bear Power – Kauf-/Verkaufsdruck
Gleitende Durchschnitte (5,10,20,50,100,200) – Langfristiger Trend
Abschließende Zusammenfassung: Das System zählt die Kauf-/Verkauf-/Neutral-Signale und gibt eine klare Empfehlung ab:
STARKER KAUF (≥7 Kaufsignale)
KAUFEN
VERKAUFEN
STARKER VERKAUF (≥7 Verkaufssignale)
NEUTRAL
🔔 Alarme und Visualisierung
Visuelle Signale im Chart:
Grüne/rote Pfeile mit "KAUFEN"/"VERKAUFEN"-Beschriftungen
Tonbenachrichtigungen (Windows)
Detaillierte Protokolle in der Konsole mit:
Signalzeit
ADX-, DI- und Volumenwerte (falls aktiviert)
🛡️ Wettbewerbsvorteile
✅ Integration mehrerer Indikatoren in ein einziges Dashboard
✅ Fokus auf Trendstärke und -richtung (nicht nur Preis)
✅ Volumenfilter für höhere Zuverlässigkeit
✅ Interaktive und informative Benutzeroberfläche
✅ Klare Signale mit visuellen und akustischen Alarmen


![„[Stellar Strategies] Market Session Ultimate“-Logo](https://cdn.ctrader.com/image/webp/61ffd537-0125-4246-9e72-42eca1791d64_28232)


