Descripción
Análisis Profesional de Volumen con Cálculo de Delta Basado en Velas Inteligentes
Desbloquee el poder del análisis de volumen de grado institucional con PERFIL DE VOLUMEN DE DELTA ANCLADA EN VELA, el indicador de perfil de volumen anclado más avanzado para cTrader. Diseñado para traders serios que exigen una visión precisa del mercado, este indicador revela dónde ocurre la verdadera actividad del mercado mediante un cálculo inteligente de delta basado en velas.
🎯 CARACTERÍSTICAS CLAVE
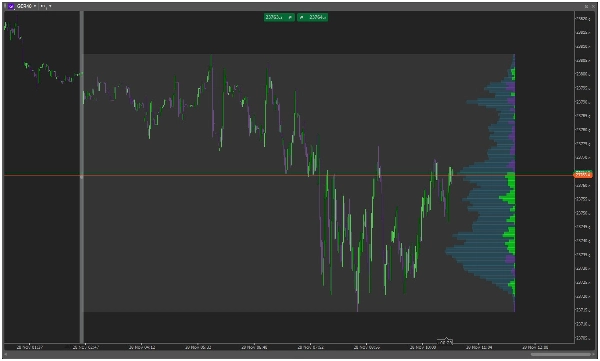
🏓 SISTEMA DE ANCLAJE INTELIGENTE
- Simplemente dibuje una línea vertical en cualquier parte de su gráfico
- Generación automática del perfil anclado en el punto elegido
- Actualizaciones dinámicas a medida que se desarrolla la acción del precio
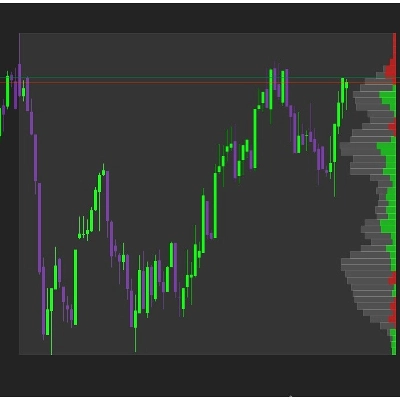
📊 DELTA INTELIGENTE BASADO EN VELAS
- Análisis avanzado de delta basado en la dirección de la vela
- Velas verdes = Volumen de compra | Velas rojas = Volumen de venta
- Visualización limpia y de un solo color por nivel de precio
- Identificación instantánea de zonas de presión de compra/venta
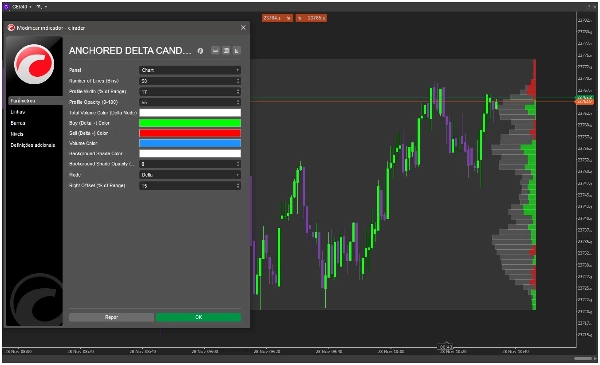
🎨 DISEÑO VISUAL PERSONALIZABLE
- Ancho de perfil ajustable (5-100% del rango)
- Colores personalizables para volumen de compra/venta/total
- Controles de transparencia para una integración perfecta en el gráfico
- Sombreado profesional para mejorar la legibilidad
⚡ MODOS DE VISUALIZACIÓN FLEXIBLES
- Modo Delta: Vea la presión neta de compra/venta en cada nivel de precio
- Modo Volumen: Visualización tradicional del perfil de volumen
- Anclado a la derecha para una utilización óptima del espacio del gráfico
🚀 POR QUÉ LOS TRADERS LO AMAN
"¡Finalmente, un perfil de volumen que realmente funciona! El cálculo de delta basado en velas es increíblemente preciso para detectar la actividad institucional." - Trader Profesional
"Un cambio radical para mi análisis de perfil de mercado. El sistema de anclaje es brillante y el enfoque basado en velas tiene mucho sentido." - Analista Institucional
📈 PERFECTO PARA
- Traders de Perfil de Mercado - Identificar áreas de valor y máximos/mínimos pobres
- Teóricos del Mercado de Subastas - Entender los procesos de desarrollo del mercado
- Estrategias Basadas en Volumen - Confirmar rupturas con validación de volumen
- Análisis de Flujo Institucional - Detectar acumulación/distribución de dinero inteligente
🛠 FÁCIL DE USAR
- Dibuje una línea vertical en su punto de anclaje
- Observe cómo el PERFIL DE VOLUMEN DE DELTA ANCLADA EN VELA se genera automáticamente
- Analice la distribución de delta a través de los niveles de precio
- Opere con confianza usando niveles confirmados por volumen
🔧 ESPECIFICACIONES TÉCNICAS
- Cálculo en tiempo real
- Bajo consumo de recursos
- Compatible con todos los marcos temporales
- Funciona con todos los instrumentos (Forex, Acciones, Cripto, Futuros)
📋 PARÁMETROS INCLUIDOS
- Número de Líneas/Bines (5-100)
- Porcentaje de Ancho del Perfil
- Controles de Opacidad
- Esquemas de Color Personalizados
- Ajuste de Desplazamiento a la Derecha
- Modo de Visualización (Delta/Volumen)
🎯 ¡TRANSFORMA TU ANÁLISIS DE GRÁFICOS HOY!
Únase a miles de traders profesionales que han elevado su análisis de mercado con PERFIL DE VOLUMEN DE DELTA ANCLADA EN VELA. Deje de adivinar y comience a ver dónde ocurre la verdadera actividad del mercado mediante un cálculo preciso de delta basado en velas.
⭐ "La claridad que este indicador aporta al análisis de volumen es inigualable. El enfoque de delta basado en velas es pura genialidad."
Agregue PERFIL DE VOLUMEN DE DELTA ANCLADA EN VELA a su plataforma cTrader hoy y opere con la visión de nivel institucional!


![Logotipo de "[Stellar Strategies] Inside Bar with Signals"](https://cdn.ctrader.com/image/webp/1d9e8bfa-3b2c-4440-bb37-5856902008a7_30683)


