Beschreibung
Kurze Beschreibung
Trend- & Volumen-Regimekarte ist ein Regimefilter für cTrader, der die Richtung und Beständigkeit von Preis und Volumen misst. Er liefert Ihnen einen normalisierten Trendwert und einen Volumentrendwert im Bereich –10 bis +10, färbt Ihre Kerzen mit einem sanften Farbverlauf von bärischem Rot bis bullischem Grün und zeigt an, ob die aktuelle Umgebung risk-on, risk-off oder einfach nur laut ist.
🧠 Was es macht
Dieser Indikator repliziert die Logik von BigBelugas „Regime Filter“ von TradingView, angepasst für cTrader und verpackt in eine klare Trend- & Volumen-Regimekarte.
Geglätteter Preis & Volumen
- Berechnet HLC3 (Durchschnitt von Hoch, Tief, Schluss) und wendet einen Hull Moving Average (HMA) an, um den Preis zu glätten.
- Wendet einen weiteren Hull Moving Average auf das Tick-Volumen an.
Trendwert (Preis)
- Für die letzten N Balken (
Length) vergleicht er den aktuellen HMA des Preises mit jedem vergangenen HMA-Wert:
- Wenn aktueller HMA > vergangener HMA → Trend +1
- Wenn aktueller HMA ≤ vergangener HMA → Trend –1
- Der akkumulierte Wert wird auf –10 … +10 skaliert → dies ist der Trendwert.
Volumentrendwert
- Verwendet dieselbe Logik, aber angewendet auf den HMA des Volumens.
- Das Ergebnis ist ein weiterer normalisierter Wert im Bereich –10 … +10 → der Volumenwert.
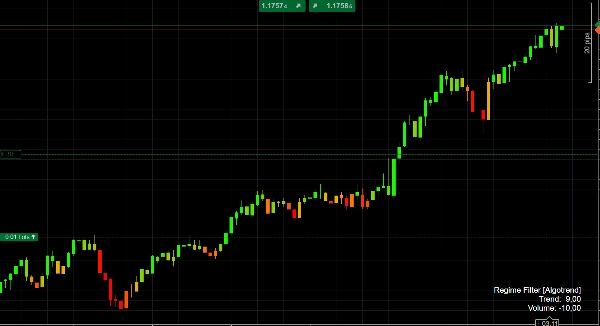
Farb-Logik
- Wenn der Trendwert negativ ist, werden die Kerzen mit einem Farbverlauf rot → orange gefärbt, abhängig davon, wie stark das Abwärtsregime ist.
- Wenn der Trendwert positiv ist, werden die Kerzen orange → limettengrün gefärbt, mit stärkerem Grün für stärkere Aufwärtsregime.
Dies gibt Ihnen einen sofortigen visuellen Hinweis darauf, ob die Kursbewegung bärisch, neutral oder bullisch ist und wie beständig dieses Regime aktuell ist.
Regime-Panel
Im Unterfenster zeichnet der Indikator:
- Trendlienie (blau)
- Volumentrendlienie (grau)
- Nulllinie (Basislinie)
Auf dem letzten Balken zeigt es ein kleines Info-Panel mit den aktuellen Trend- und Volumenwerten an.
🎯 Wie Sie es verwenden können
Trendbestätigung
- Handeln Sie nur in Richtung eines starken Regimes, zum Beispiel:
- Trend > +4 → Long-only Tendenz
- Trend < –4 → Short-only Tendenz
Regimefilter
- Schalten Sie Ihre Strategie aus oder drosseln Sie sie, wenn das Regime schwach ist (Trend nahe 0) oder wenn der Volumentrend stark negativ ist, was oft auf unruhige oder nachlassende Bewegungen hinweist.
Kontext für Signale
Kombinieren Sie Ihre bestehenden Einstiegssignale (Preisbewegung, harmonische Muster, Oszillatoren usw.) mit der Trend- & Volumen-Regimekarte als Makrofilter:
- Nehmen Sie nur Breakouts, wenn der Trend positiv und der Volumentrend ebenfalls positiv ist.
- Vermeiden Sie Mean-Reversion-Setups, wenn der Trend extrem stark ist (> +8 oder < –8), da sich der Markt in einem kraftvollen Richtungsregime befindet.
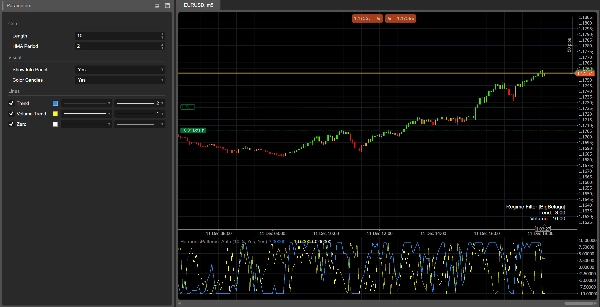
⚙️ Eingabeparameter
Kern
Length
Anzahl der Balken, die zur Berechnung der Trend- und Volumenwerte verwendet werden.
- Höhere Werte → glatteres, mehr „makro“-Regime; langsamer in der Veränderung, aber stabiler.
- Niedrigere Werte → schnellere Reaktion, aber mehr Rauschen und häufigere Wechsel.
HMA-Periode
Periode des Hull Moving Average, der zur Glättung von Preis und Volumen verwendet wird.
- Passen Sie sie an Ihren Zeitrahmen und Handelsstil an: kürzer für niedrige Zeitrahmen, länger für höhere Zeitrahmen.
Visuell
Info-Panel anzeigen
Zeigt/versteckt das kleine Textpanel auf dem letzten Balken mit den aktuellen Trend- und Volumenwerten.Kerzen färben
Ermöglicht die Kerzenfärbung basierend auf dem Trend-Wert (Rot / Orange / Grün Farbverlauf). Schalten Sie es aus, wenn Sie Ihre Standarddiagrammfarben beibehalten möchten.
✅ Interpretations-Spickzettel
- Trend ≥ +7 → starkes bullisches Regime, Kerzen leuchtend grün.
- Trend zwischen +3 und +7 → bullische Tendenz; Rücksetzer sind potenzielle Kaufzonen.
- Trend zwischen –3 und +3 → seitwärts / unruhig; Signale sind weniger zuverlässig.
- Trend ≤ –7 → starkes bärisches Regime, Kerzen tiefrot.
- Volumentrend > 0 → steigende / anhaltende Aktivität, Bewegungen sind wahrscheinlicher „echt“ und beständig.
- Volumentrend < 0 → nachlassende Teilnahme, höheres Risiko für falsche Bewegungen, Unruhe oder Umkehrungen.
Zusammenfassung
Kundenbewertungen
5 | 0 % | |
4 | 100 % | |
3 | 0 % | |
2 | 0 % | |
1 | 0 % |


