
Beschreibung
Preisprojektion Dynamisch 📈🔮
https://chartshots.spotware.com/c/69d5304ea1cc1
Was ist das?
https://chartshots.spotware.com/c/69d52fb4b01cd
Preisprojektion Dynamisch ist ein Overlay-Indikator, der statistisch wahrscheinliche zukünftige Preisverläufe mithilfe der Monte-Carlo-Simulation projiziert und die Richtungsneigung durch einen Bayesschen Wahrscheinlichkeitsklassifikator bewertet. Er beantwortet eine Frage: Angesichts der bisherigen Bewegung dieses Assets, wohin wird es statistisch wahrscheinlich als Nächstes gehen? 📊
https://chartshots.spotware.com/c/69d53010d38ce
Wie es funktioniert ⚙️
Motor 1 — Monte-Carlo-Projektion 🎲
Der Indikator analysiert die jüngste Preisgeschichte und extrahiert logarithmische Renditen. Er berechnet die durchschnittliche Rendite und deren Standardabweichung — erfasst dabei sowohl die Drift (Tendenz) als auch die Volatilität (unregelmäßige Bewegung) 🌪️.
Er führt 200 simulierte Preisverläufe (bis zu 500) in die Zukunft durch. Jede Simulation ist ein "Random Walk" basierend auf der realen jüngsten Bewegung. Daraus extrahiert der Indikator 5 Perzentil-Bänder:
Band
Bedeutung
95%
Optimistisches Extrem — nur 5% der Simulationen lagen höher 🚀
75%
Oberer wahrscheinlicher Bereich — der Preis lag in 25% der Simulationen darüber 📈
50% (MD)
Median-Projektion — das statistische Zentrum aller Ergebnisse 🎯
25%
Unterer wahrscheinlicher Bereich — der Preis lag in 25% der Simulationen darunter 📉
05%
Pessimistisches Extrem — nur 5% der Simulationen lagen niedriger 📉🛑
Profi-Tipp: Je weiter sich der Fächer öffnet, desto höher ist die aktuelle Volatilität 📢. Ein enger Fächer bedeutet, dass sich das Asset vorhersehbar bewegt 🧵.
Motor 2 — Bayesscher Klassifikator 🧠
Unabhängig von der Projektion klassifiziert dieser Motor den Markt als bullisch oder bärisch durch:
- Rückblick über ein Fenster (Standard 500 Balken) 🔍.
- Messung von relativem Volumen und Momentum für bullische vs. bärische Balken.
- Berechnung, welches Profil der aktuelle Balken besser mit der Gaußschen Wahrscheinlichkeit passt ⚖️.
Das Ergebnis ist ein Gewinnwahrscheinlichkeitsprozentsatz:
Wahrscheinlichkeit
Interpretation
> 70%
Hohe bullische Zuversicht ✅🟢
50–70%
Mäßig / unklar ⚖️🟡
< 30%
Hohe bärische Zuversicht ✅🔴
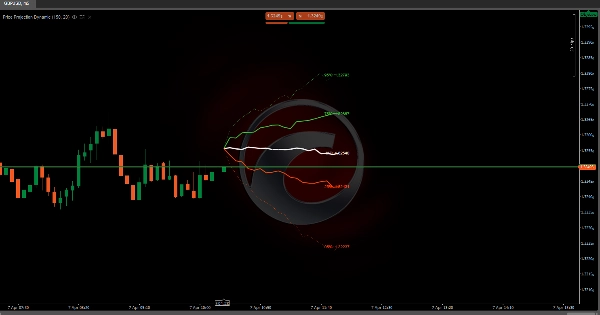
Visuelle Elemente 🎨
- Grüne Linien (75%, 95%): Obere Projektionsbänder — bullischer Bereich 🍏
- Weiße Linie (MD): Median projizierter Preis — wahrscheinlichster Pfad 🏁
- Orange Linien (25%, 05%): Untere Projektionsbänder — bärischer Bereich 🍊
- Gepunktete äußere Linien: 95% und 05% Extreme (Grenzen mit niedriger Wahrscheinlichkeit) ⚠️
- Durchgezogene innere Linien: 75%, 50%, 25% (Zone hoher Wahrscheinlichkeit) ✅
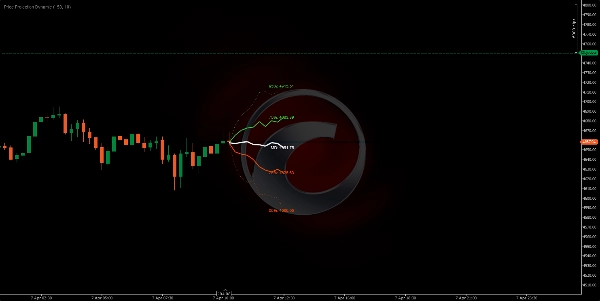
- Preisetiketten: Exakter projizierter Preis für jedes Perzentil 🏷️
- Info-Panel (oben rechts): Bayessche Gewinnwahrscheinlichkeit, Medianziel, relatives Volumen, Signale Richtung 🖥️
Anwendung 📖
- Lies die Form des Fächers 📢 — Wenn er sich schnell ausdehnt, ist die Volatilität hoch und die Projektionen sind weniger sicher.
- Verwende die Medianlinie (MD) 🎯 als das statistisch wahrscheinlichste zukünftige Kursziel.
- Nutze die 75%/25% Bänder 📏 als realistische obere/untere Ziele für Trades.
- Nutze die 95%/05% Bänder 🛑 als extreme Grenzen — nützlich für Stop-Loss-Platzierung.
- Überprüfe das Bayessche Panel 🧠 — Eine Wahrscheinlichkeit über 70% oder unter 30% verstärkt die Richtungsüberzeugung.
- Kombiniere beide Motoren 🤝 — Wenn die Medianlinie nach oben geneigt ist UND die Bayessche Wahrscheinlichkeit > 70% ist, ist das Setup statistisch stark.
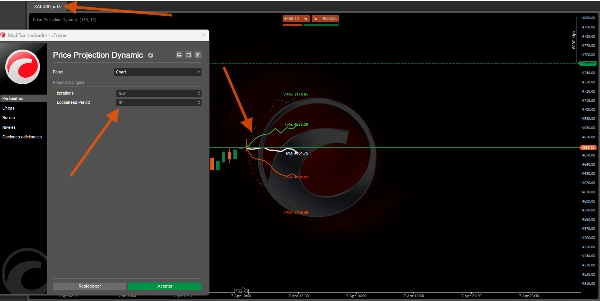
Wichtige Parameter ⚙️
Parameter
Was es steuert
Höherer Wert
Niedrigerer Wert
Iterationen
Anzahl der simulierten Pfade
Glattere Bänder 🌊
Schnellere Berechnung ⚡
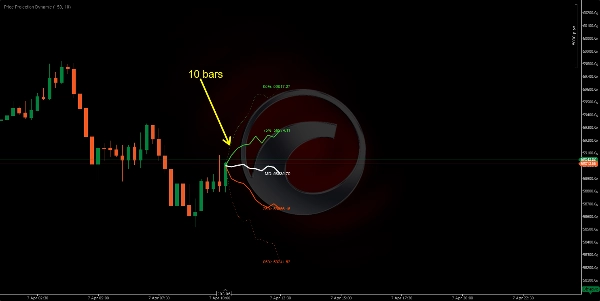
Vorausschau
Zukunftsprojektion Entfernung
Längerer Horizont 🔭
Kürzer, zuverlässiger 🔍
Stichprobentiefe
Zu analysierende jüngste Balken
Langfristiges Verhalten 🐢
Nur jüngstes Verhalten 🐇
Klassifikatorfenster
Bayessche Historie
Stabilere Wahrscheinlichkeit ⚖️
Reaktiver ⚡
Indikatorprofil 📋
- Indikator-Kategorie: Statistik 📊
- Ausgabetyp: Visualisierung & Signale 🖼️
- Datenanforderungen: Nur Balken 📶
Haftungsausschluss ⚠️
Dieser Indikator projiziert statistische Wahrscheinlichkeiten, keine Vorhersagen 🔮. Monte-Carlo-Simulationen gehen davon aus, dass die Zukunft der jüngsten Vergangenheit ähnelt — dies bricht während Black-Swan-Ereignissen 🦢 oder nachrichtengetriebenen Kurslücken. Verwenden Sie es als probabilistisches Rahmenwerk zusammen mit Ihrem eigenen Risikomanagement 🛡️.
Zusammenfassung
Separately, the Bayesian classifier evaluates market sentiment by analyzing relative volume and momentum over a configurable window, providing a win probability percentage that indicates bullish or bearish confidence. Visual elements include color-coded projection bands (green for bullish, orange for bearish), a median price line, price labels for each percentile, and an info panel displaying Bayesian probability and other metrics.
Key adjustable parameters include the number of simulation iterations, projection horizon, sample depth of historical bars, and classifier window size. The indicator requires bar data with volume and outputs visual projections and directional signals. It is designed to offer a probabilistic framework for anticipating price movement based on recent market behavior, suitable for various symbols including BTCUSD, EURUSD, GBPUSD, XAUUSD, NAS100, and others.
Kundenbewertungen
5 | 0 % | |
4 | 100 % | |
3 | 0 % | |
2 | 0 % | |
1 | 0 % |


