Coloring Trendline with arrows
"Coloring Trendline with arrows" logo
03/09/2025
2
Desktop
Since 12/03/2025
Sales
5
"Coloring Trendline with arrows" uploaded image"Coloring Trendline with arrows" uploaded image

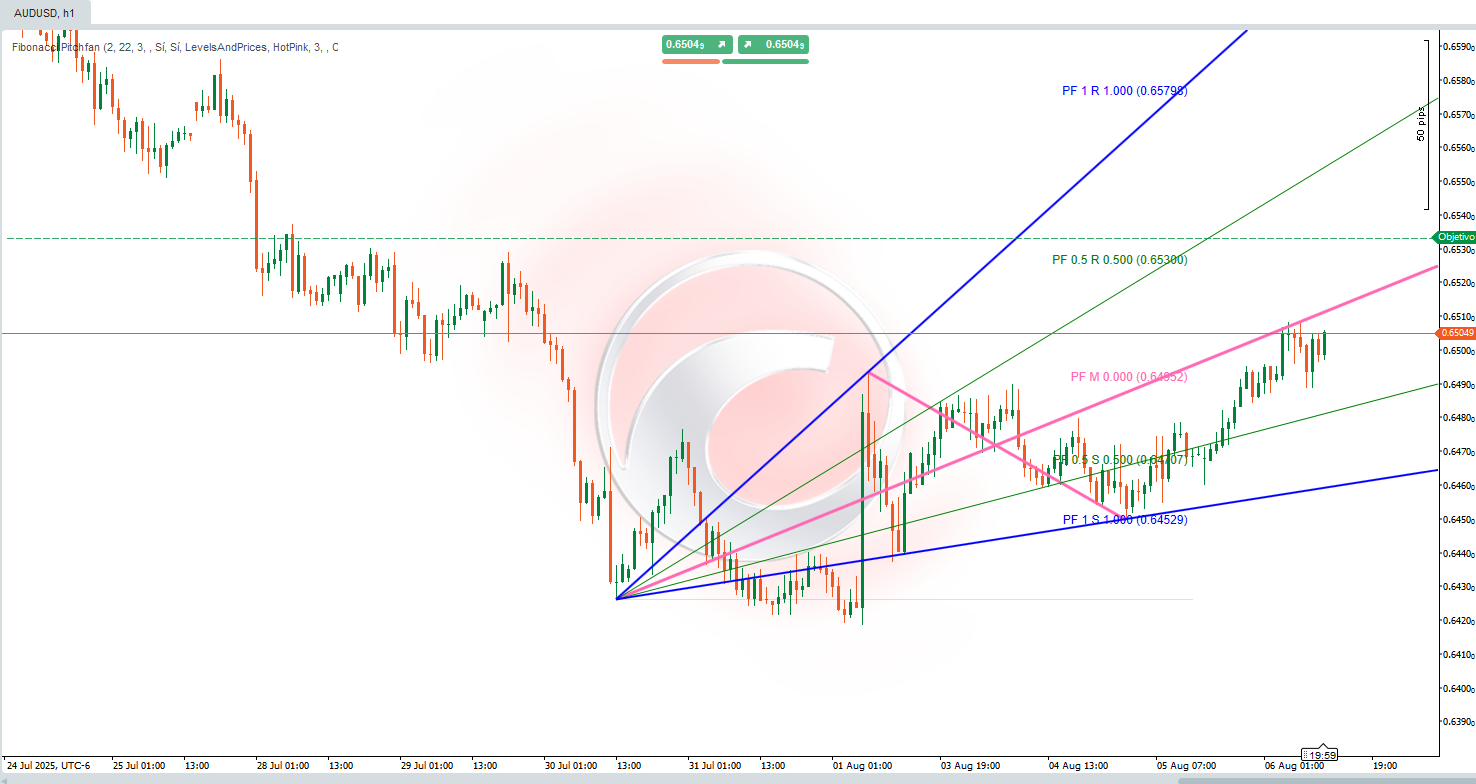
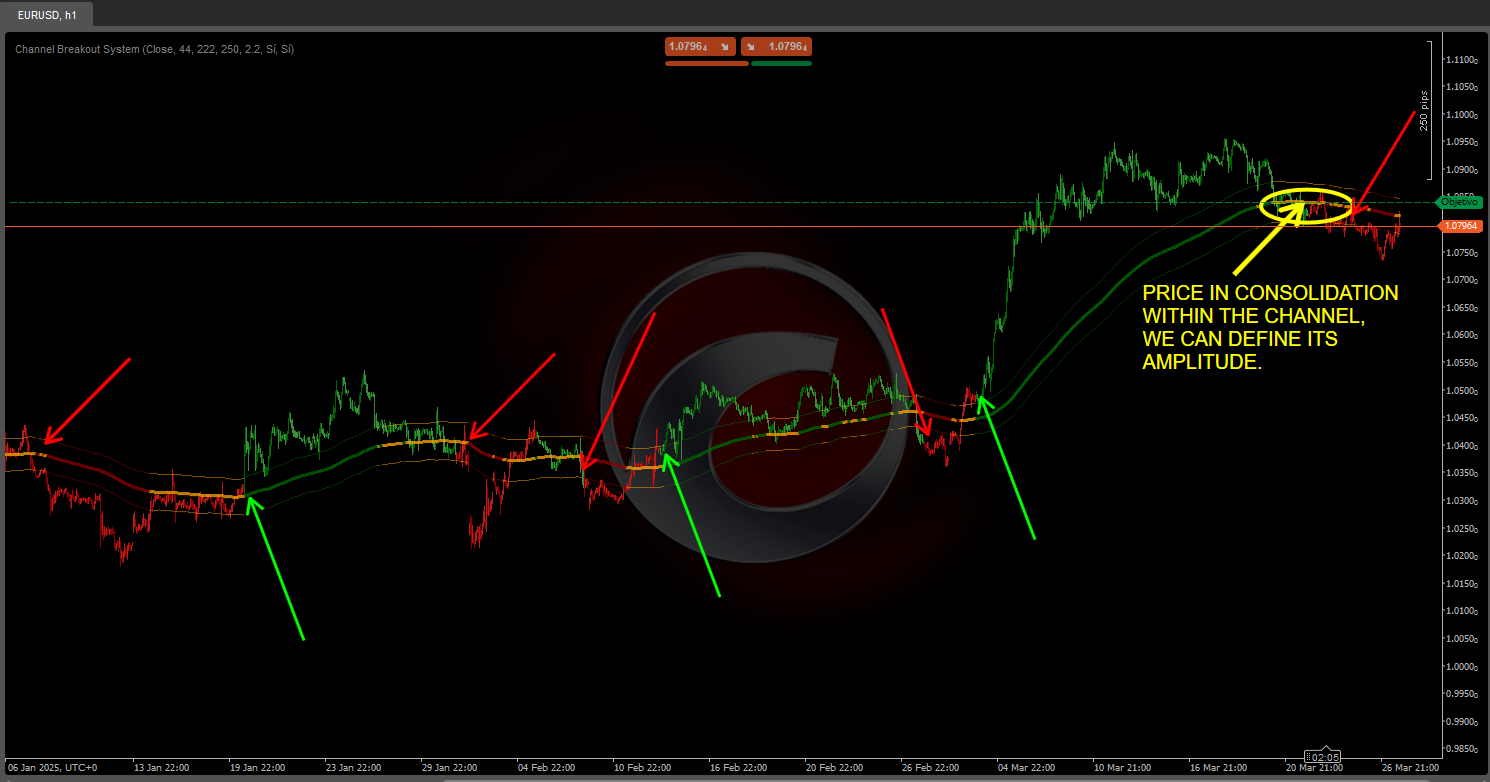
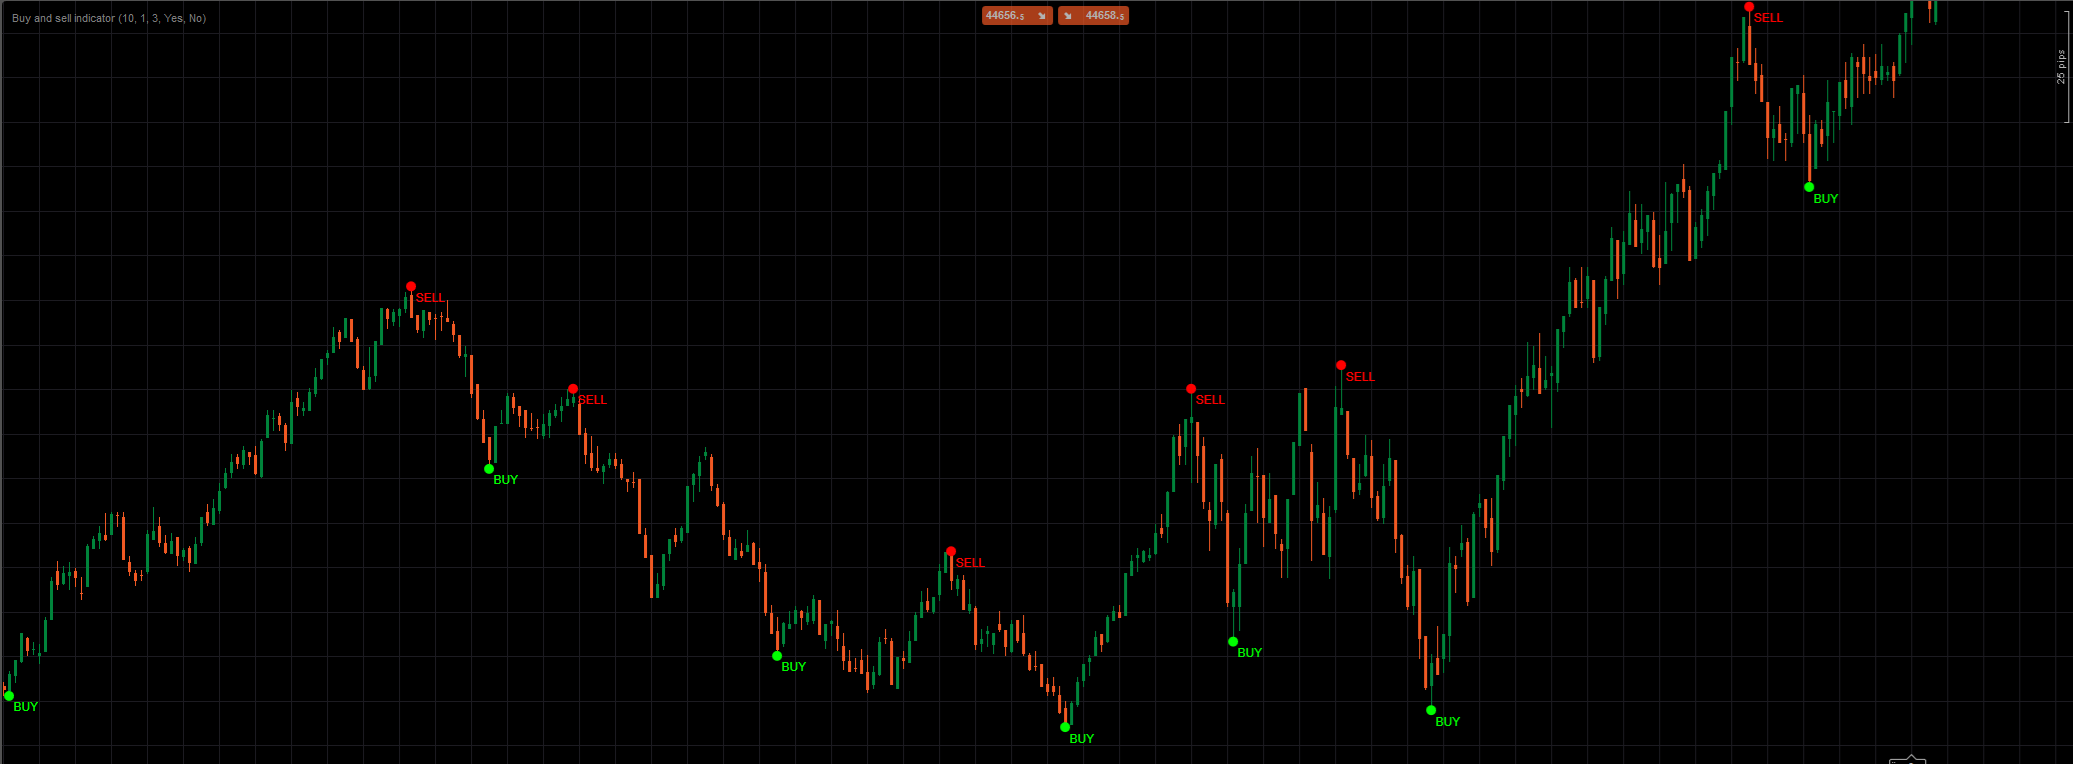
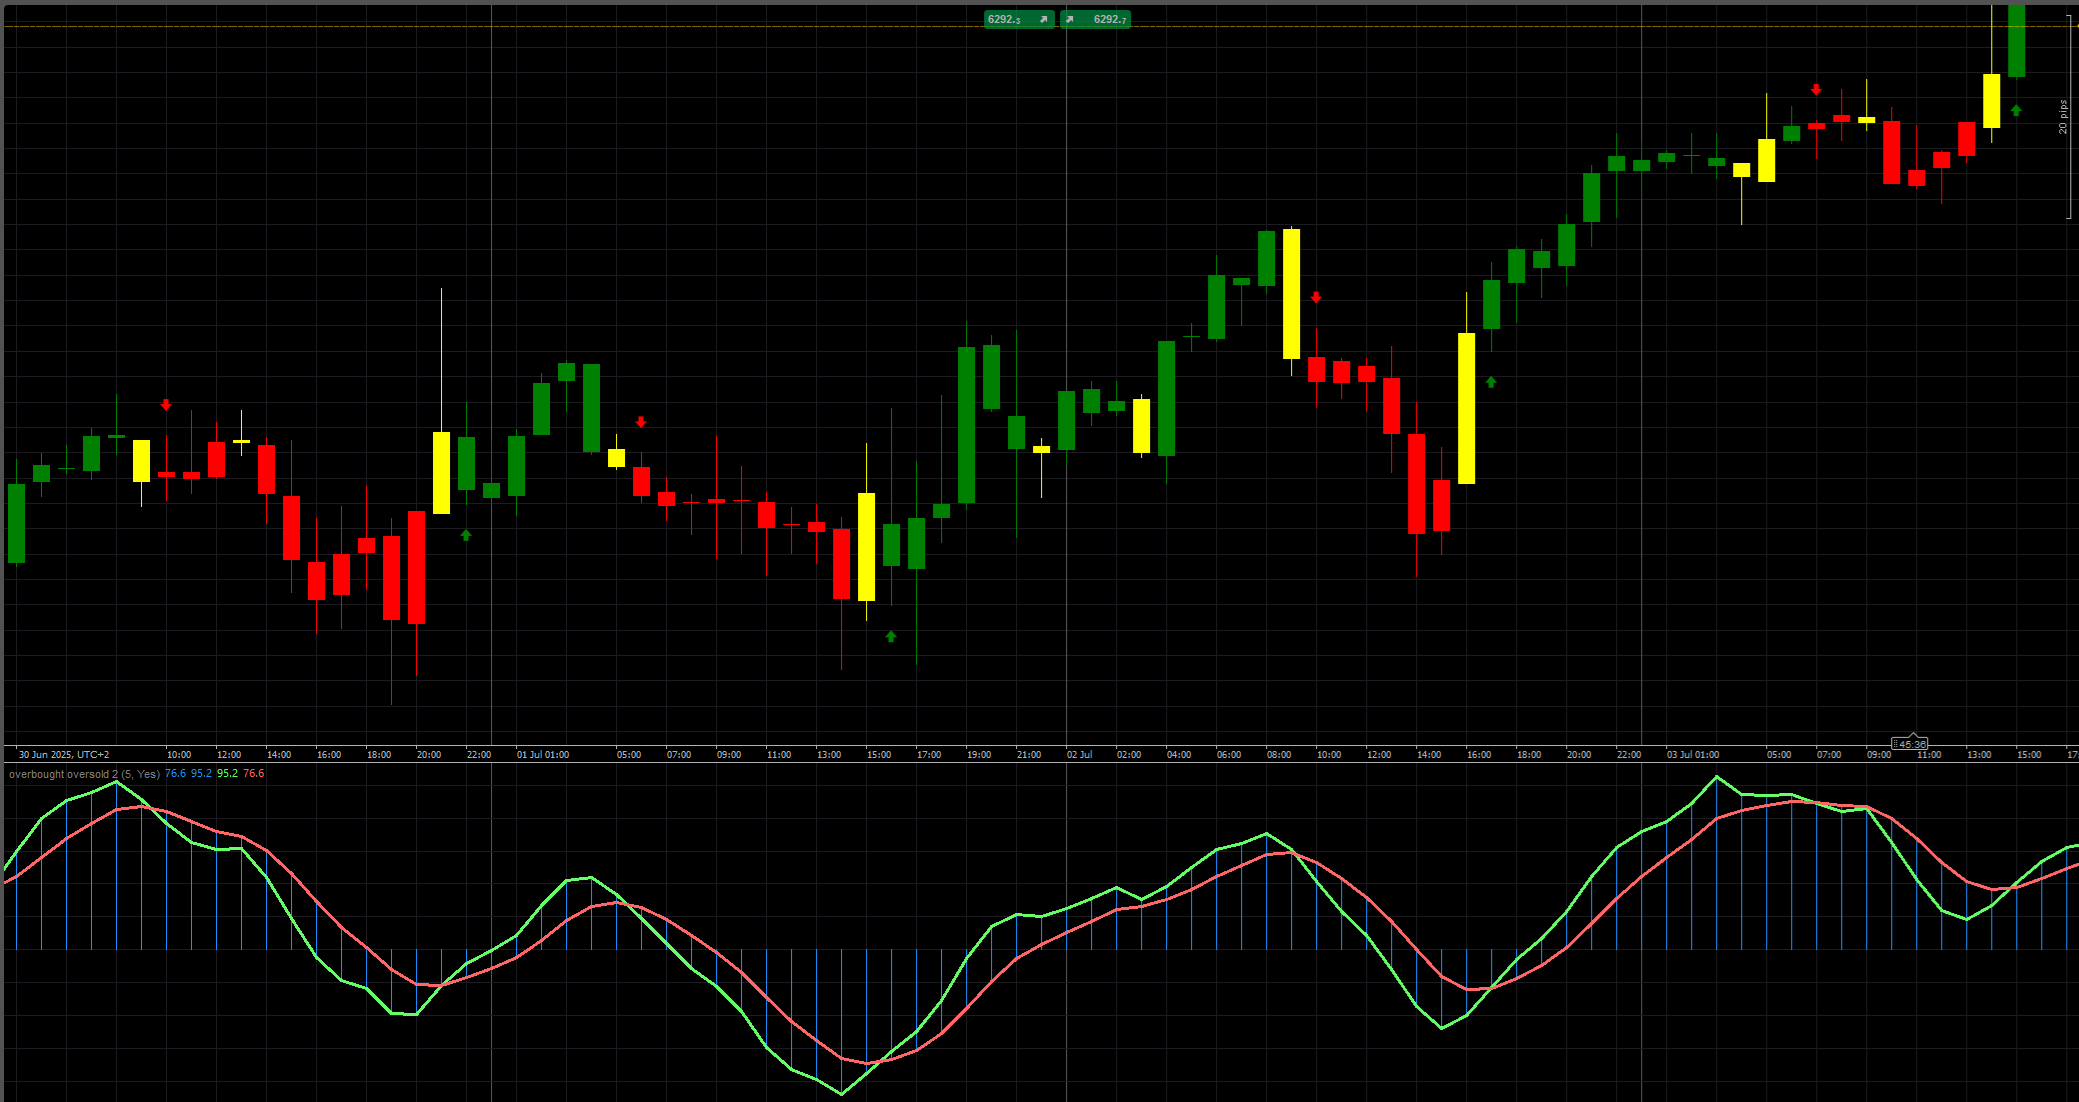
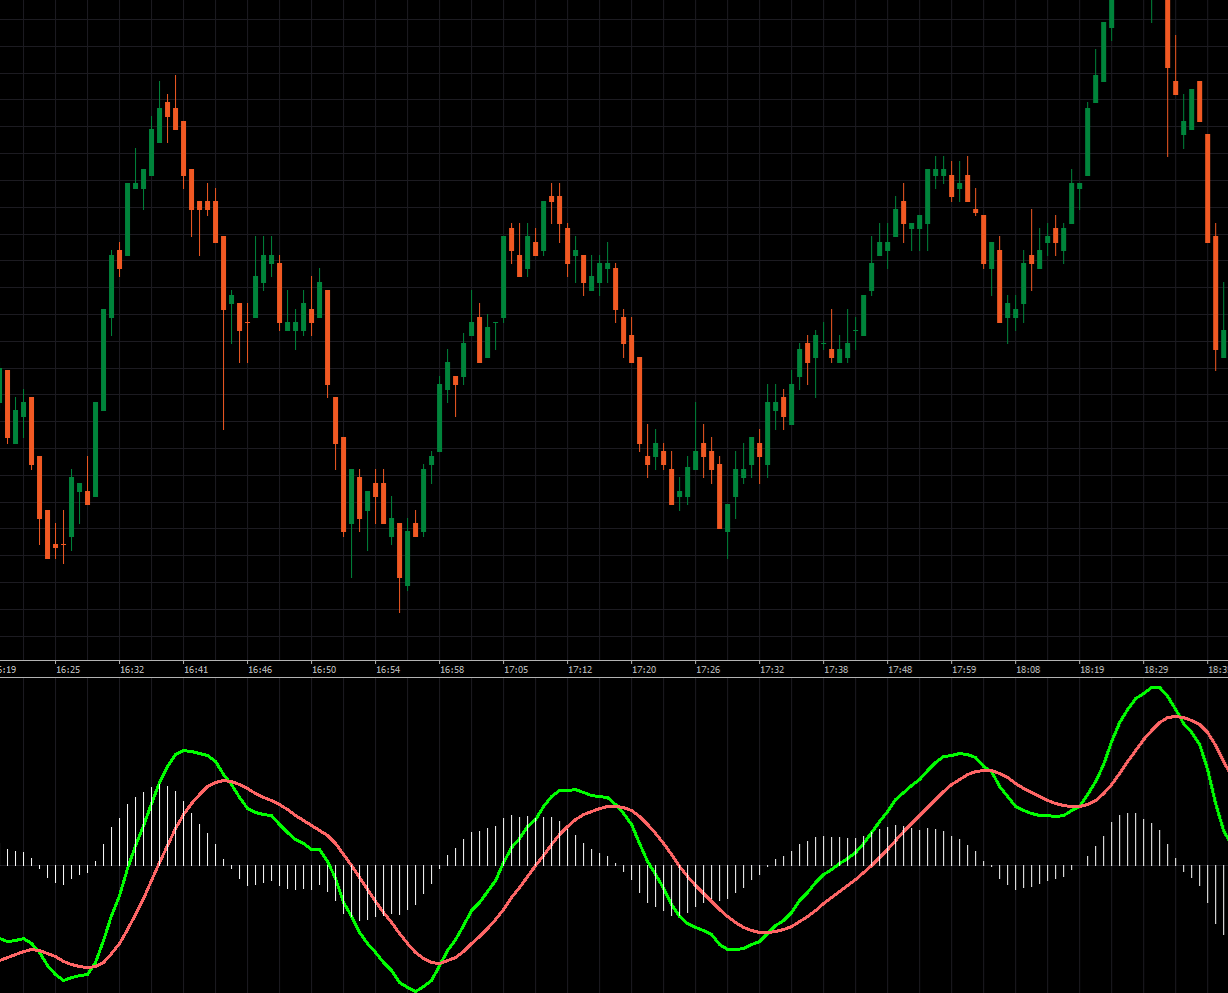
Coloring trendline/ Colored Trendline / Color Trendline

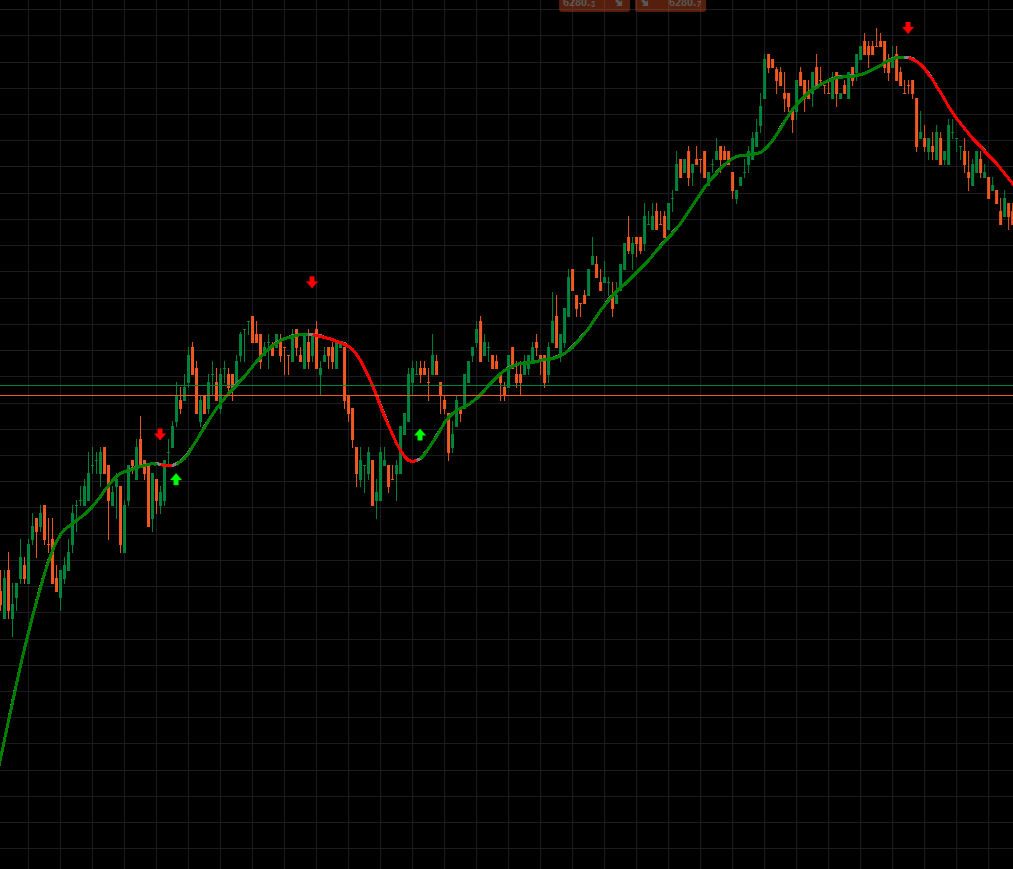
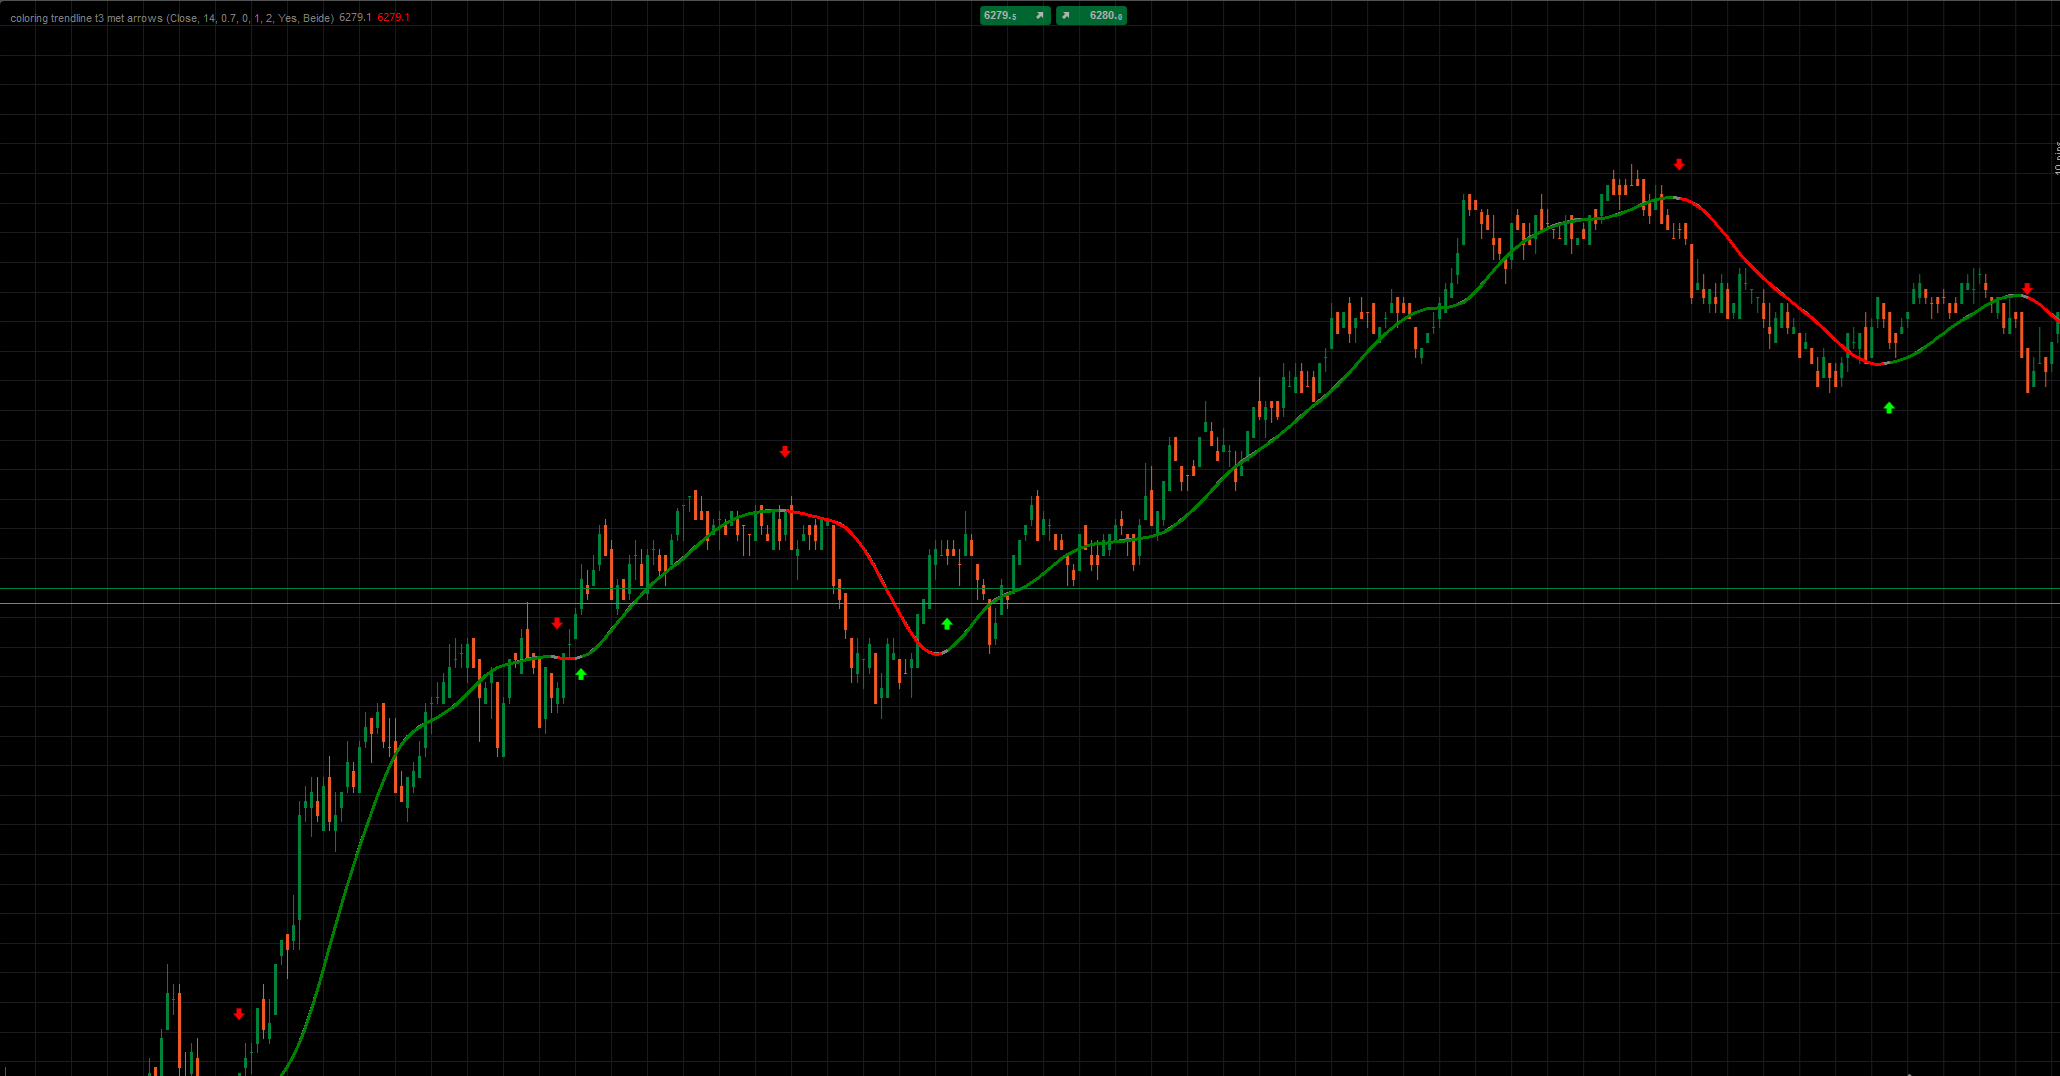
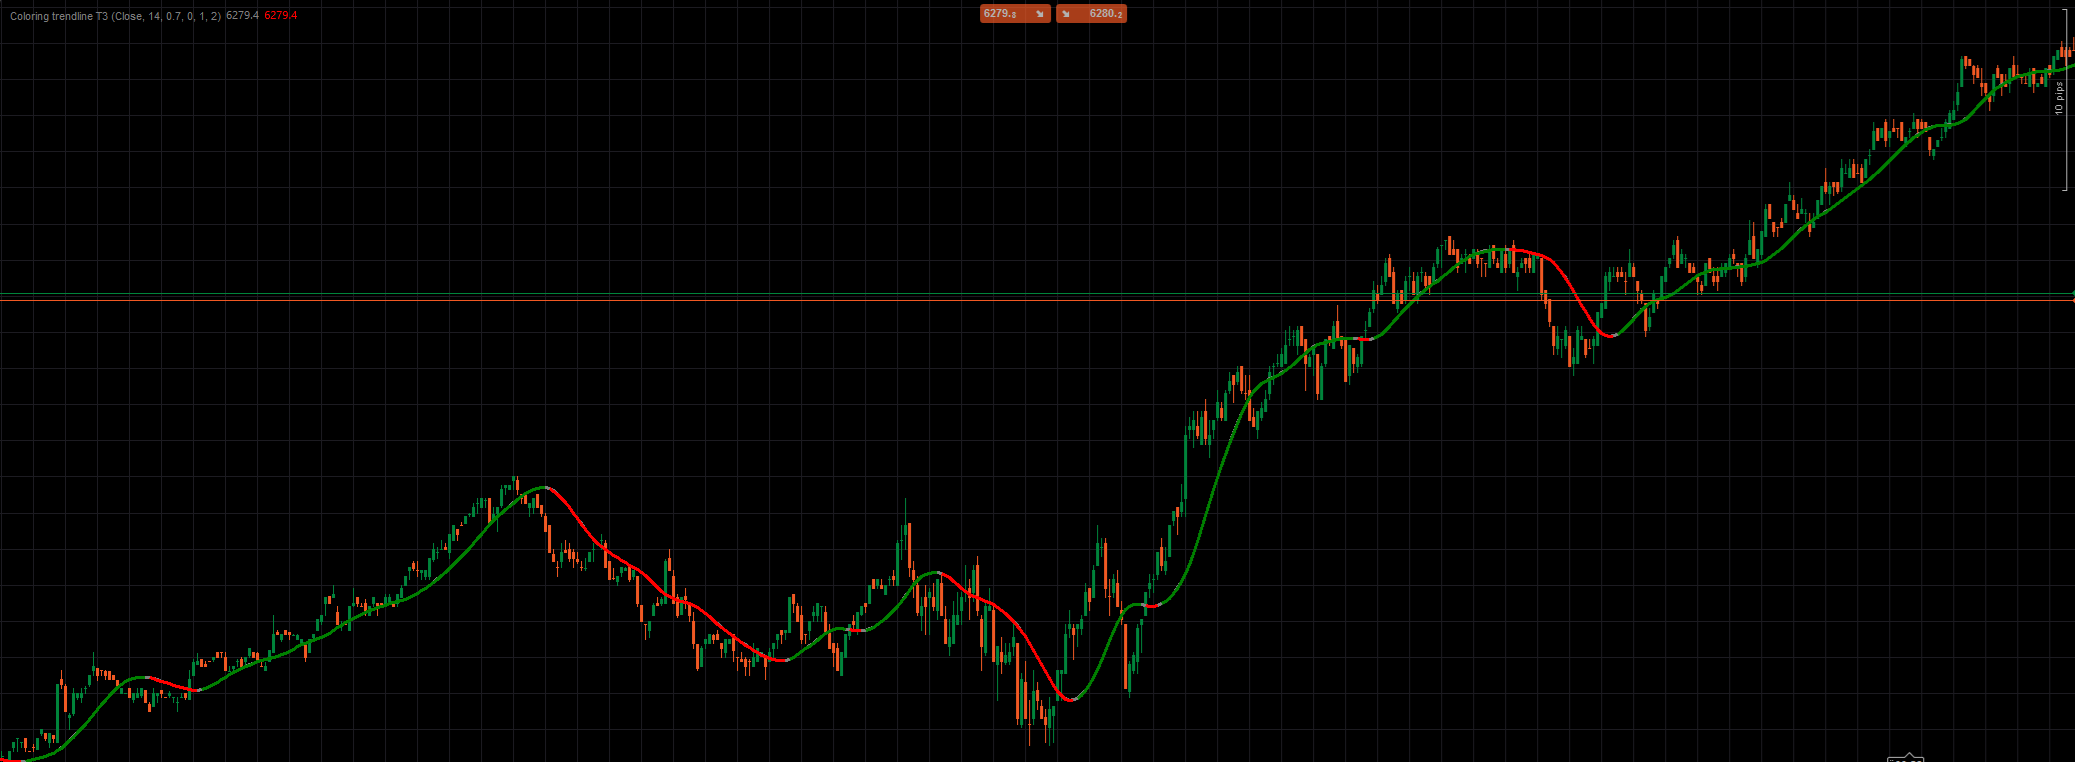
Unlock smoother, more responsive trend signals with the T3MA indicator: a triple-EMA powerhouse that blends six cascaded EMAs using your chosen volume factor for the perfect balance of lag reduction and noise filtering. Customize your sensitivity with period and volume factor inputs, set thresholds for clean trend confirmations, and let the built-in arrow alerts highlight every shift—green arrows for uptrends, red for downtrends. Overlay it on your chart to spot trend pivots instantly and trade with confidence!

optional arrows: Yes or No

More from this author
Buy and sell indicator
Buy and Sell Signals
overbought oversold
Overbought Oversold Indicator
overbought oversold cbot
Overbought Oversold Cbot
Decision Point
Decision Point
You may also like
Fibonacci Pitchfan
Powerful all-in-one tool for traders seeking a clear, dynamic view of market structure. By merging pivots, trendlines &
BLOCK LIQUIDITY PRO
Block Liquidity,indicator.Block Order, Liquids Stops, Signal Sentiment,signal correctio.
Indicator
Indices
XAUUSD
Breakout
+8
MarketRegimeAI
A cutting‑edge trading indicator that fuses AI and mathematics with adaptive logic to classify market regimes.
JMA-Like
JMA-like is a highly responsive and ultra-smooth moving average designed to replicate the behavior of the original JMA!
Indicator
Indices
Prop
Stocks
+6
New Way Sar - Pro
The Parabolic SAR, or "Stop and Reverse," is a dynamic technical analysis tool
Time To Break Even Lite Version
This is the trial version of Time To Break Even, which help you time your trade entry.
VWAP Tabajara
VWAP Tabajara
Top-rated
VWAP Pro
Advanced VWAP with up to 30 anchored levels, multiple timeframes, memory mode, standard deviation bands & simple GUI
VolumeRenkoRange
Volume for Renko/Range
Indicator
RSI
XAUUSD
Breakout
+4
Dynamic Market Structure Analysis of Turning Points
Identify market structure effortlessly with swing highs, lows, CHoCH, and BOS levels for smart trading decisions! 📊🔍"
ZigZag Price Liquidity Projection
📊 ZigZag Liquidity Projection: Predict bounces/breaks using pivots, ATR & volume.
Multi_TF Candlestick Chart Overlay
Perfect for traders who demand a clear overview of multiple timeframes at a glance.
Zero Lag LSMA
ZLSMA: Zero-lag trend indicator! Catch trends fast with customizable settings. Boost your trading precision.
VolumeProfile_8
Scalpers Volume Profile
Indicator
RSI
XAUUSD
Breakout
+4
ICT Power of 3
🎯 Auto-plots key zones (Accumulation, Manipulation, Distribution) . Reveals institutional traps & trends.
Market Sessions
Market Sessions is very important for traders.
Indicator
Signal
Hammer Pattern Indicator
Indicator
RSI
Breakout
ATR
+2
Channel Breakout System
🚀 Specialized algorithm is designed to confirm entry and exit points with precision 🎯