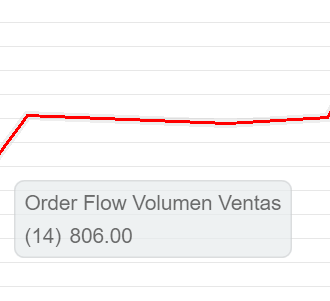
"Order Flow" logo
Order Flow
0.0
23/08/2025
32
Desktop

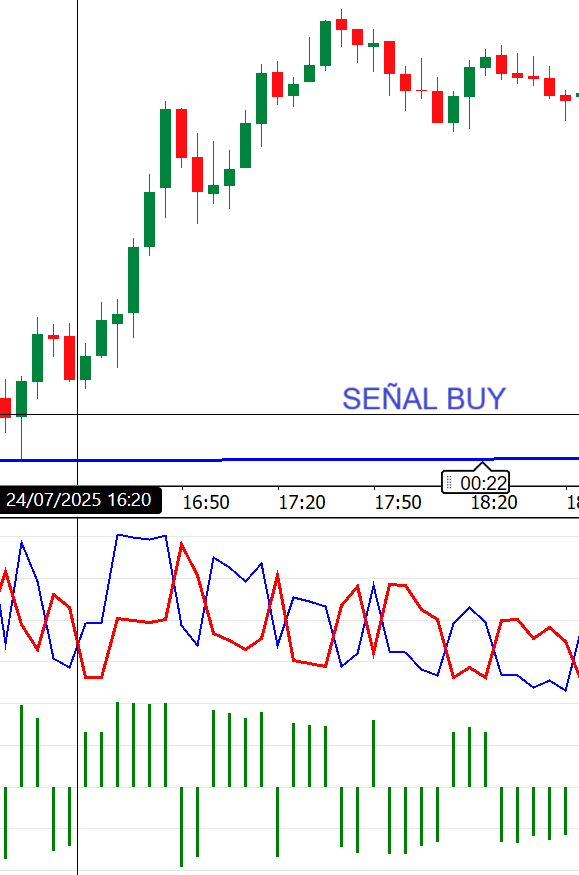
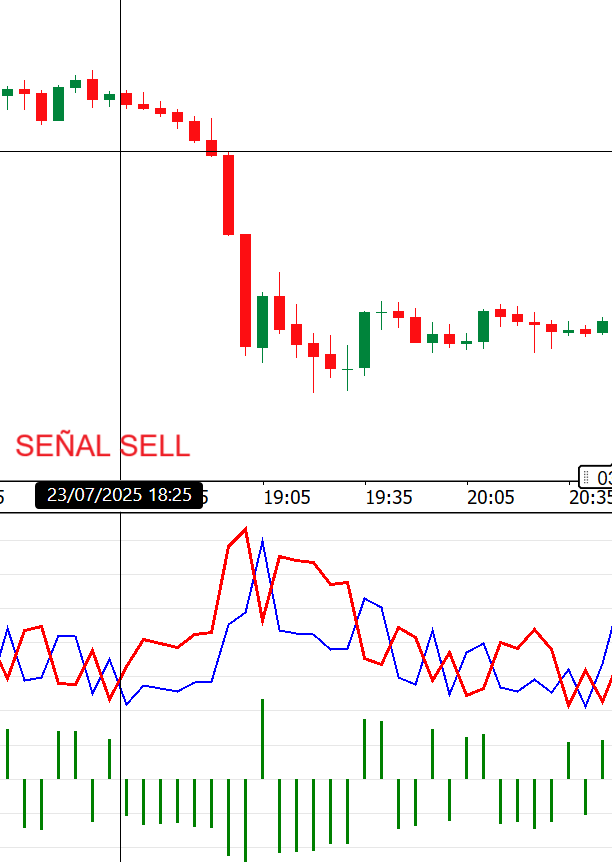
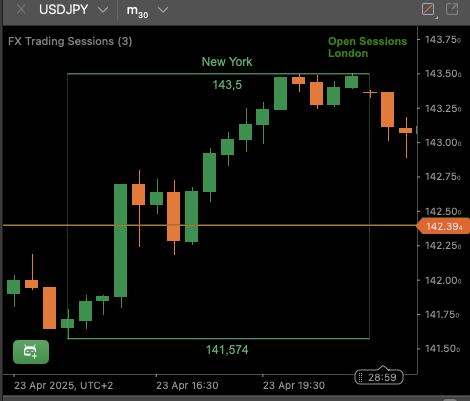
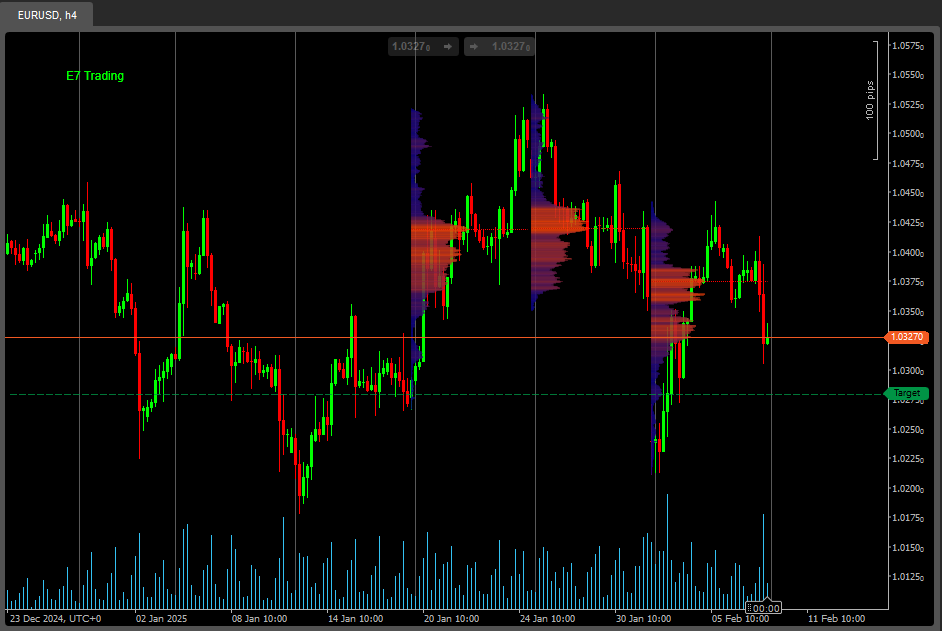
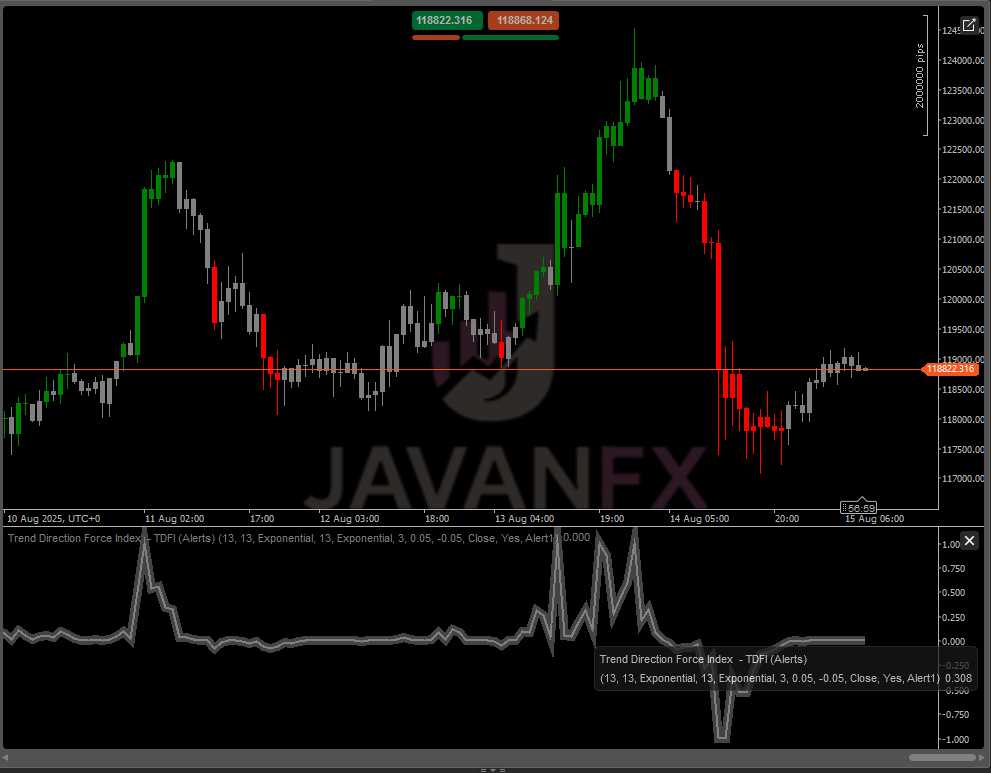
Confirmar la dirección del precio:

  • Si el precio está subiendo y el Volumen Delta es positivo (histograma verde arriba de cero), esto confirma que hay presión de compra, lo que sugiere que podrías entrar en una operación de compra ("buy") para aprovechar el movimiento alcista.
  • Si el precio está bajando y el Volumen Delta es negativo (histograma verde abajo de cero), confirma presión de venta, lo que podría ser un buen momento para una operación de venta ("sell").
More from this author
Precio Promedio Ponderado por Volumen
VWAP (Volume Weighted Average Price, Precio Promedio Ponderado por Volumen)
EMA Crossover Pro
Automatiza tus operaciones con esta estrategia de cruce de medias móviles exponenciales (EMAs). EMA Crossover Pro.
cBot
commodities
xauusd
atr
+2
Long Grid Remaining Candle Time
Hello, traders! I'm the newest and most powerful algorithmic addition. My specialty? GOLD. I trade the pair with precis
You may also like
Indicator
breakout
Pivot Points Daily Session
Pivot Point with base zone daily Asia-London-New york Session.
VegaXLR - RSI and StochRSI Alerts
VegaXLR's cTrader StochRSI identifies overbought/oversold RSI levels for precise trade entries.
VWAP Tokyo Open
VWAP Set to Tokyo Open
Indicator
breakout
supertrend
rsi
Adaptive Trend Channel
📊 Visualize market trends more clearly and dynamically
IR Spread
show spread on chart
Renko 4k Pips
Custom your Renko Brick how do you wish!
Larry Williams 9.1
Larry Williams 9.1
Pivot Points
Pivot Points Indicator
Tradingview Economic Calendar onn Chart
Customizable window inside your platform, access to any website Calendar
Indicator
signal
Half Trend BT
Half Trend BT by BullittTraders
IVB 2.0
IVB 2.0 is an indicator that works on the strategy of imbalance of the maximum volatility box of indices
VWAP
Track VWAP for Asia, London, NY, Sydney, Daily, Weekly, Monthly & Custom Sessions. Perfect for FX & intraday trading!
CicloQuatroVelas
Ciclo4Velas com marcação de 50% da amplitude e muito mais ! veja na descrição e bons trades.
Time Marker
CaptraTimeMarker: Marks key trading hours with lines & labels, plus daily separators for cTrader. Customizable & precise
TSPivotSMC
Pivot Point MultiTimeFrame with Order Block
HTFBB
Plot higher-timeframe Bollinger Bands for clearer structure, pullback zones, and breakout signals—without switching char
FAIR VALUE GAP INDICATOR
Pinpoint FVGs, track fills and see mitigation stats — trade imbalances with clarity and confidence.
Indicator
signal
Trend Bars Color
New Trend whit buy-sell signal