Zero Lag Exponential Moving Average
13/08/2025
47
Desktop
Since 14/07/2025
Free installs
47
The ZLEMA (Zero Lag Exponential Moving Average) is an advanced version of the Exponential Moving Average (EMA) designed to reduce the lag commonly associated with traditional EMAs. By using a specialized calculation method, ZLEMA reacts more quickly to price changes, making it especially effective in volatile markets.
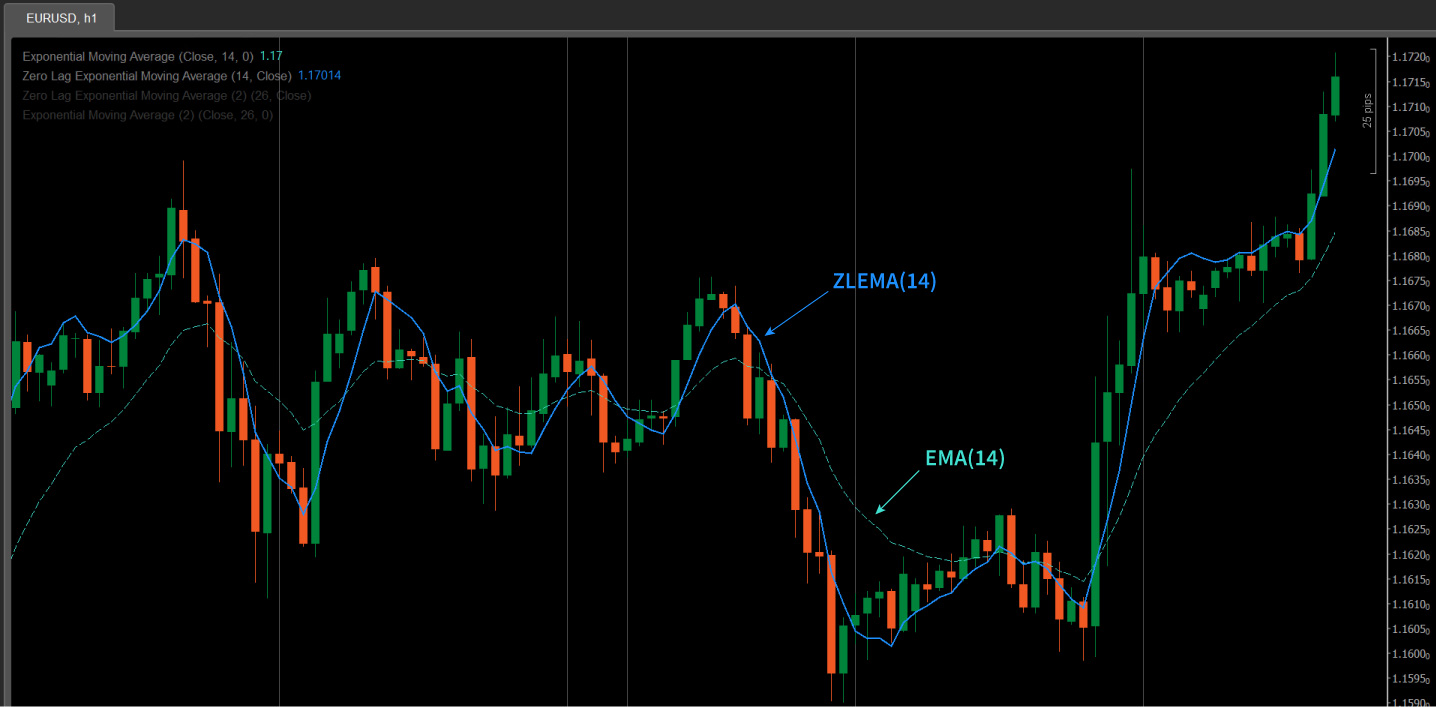
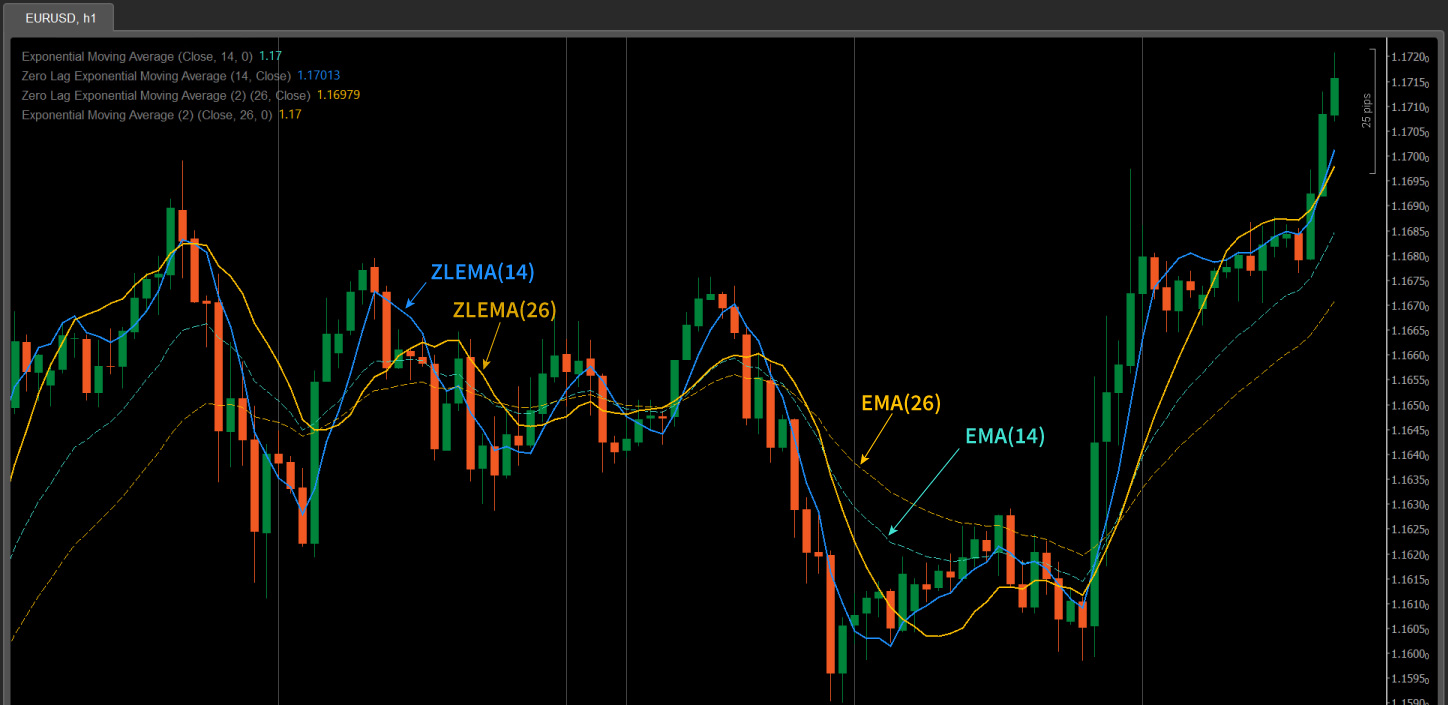
The key feature of ZLEMA is its "zero lag" characteristic, allowing it to follow price movements more closely, particularly in fast-moving market conditions. Compared to traditional EMA, ZLEMA offers faster response times, making it more timely in capturing market trends.
ZLEMA vs EMA
- Response Speed: ZLEMA reacts faster than traditional EMA. By compensating for lag, it follows price changes more promptly.
- Smoothing Effect: ZLEMA maintains the smoothing effect similar to EMA, while minimizing price lag, making it better suited for fast-moving markets.
- Use Case: If you're trading in a highly volatile market (such as short-term or intraday trading), ZLEMA can outperform EMA in terms of responsiveness.
Features of ZLEMA Indicator
- Zero Lag Response: ZLEMA reduces lag, enabling it to respond quickly to market price fluctuations, making it more accurate for capturing rapid market changes.
- Smoothness: Despite offering faster responsiveness, ZLEMA retains the smoothing effect of EMA, helping to avoid noise caused by price fluctuations.
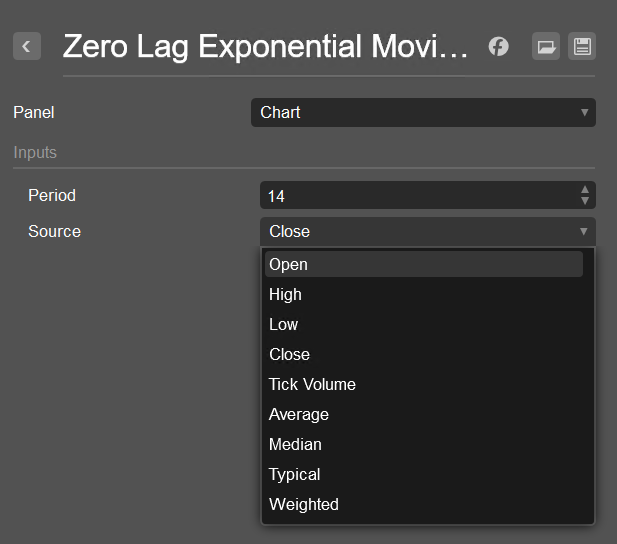
- Flexibility: ZLEMA can be used with different price data sources (such as
Close,Open,High, etc.), allowing traders to adjust it based on their strategy needs. - Trend Following and Reversal Signal Confirmation: ZLEMA is ideal for identifying trend changes, especially in volatile markets, and confirming price reversal signals.
How to Use the ZLEMA Indicator
- Short-Term Traders: ZLEMA is perfect for short-term traders as it can quickly respond to price fluctuations. Its fast reaction makes it ideal for capturing short-term trend reversals or breakout signals.
- Trend Following: ZLEMA can also be used for tracking long-term trends but offers more sensitivity than EMA. In a strong trend, ZLEMA helps to identify the start or end of trends more quickly, assisting in timely strategy adjustments.
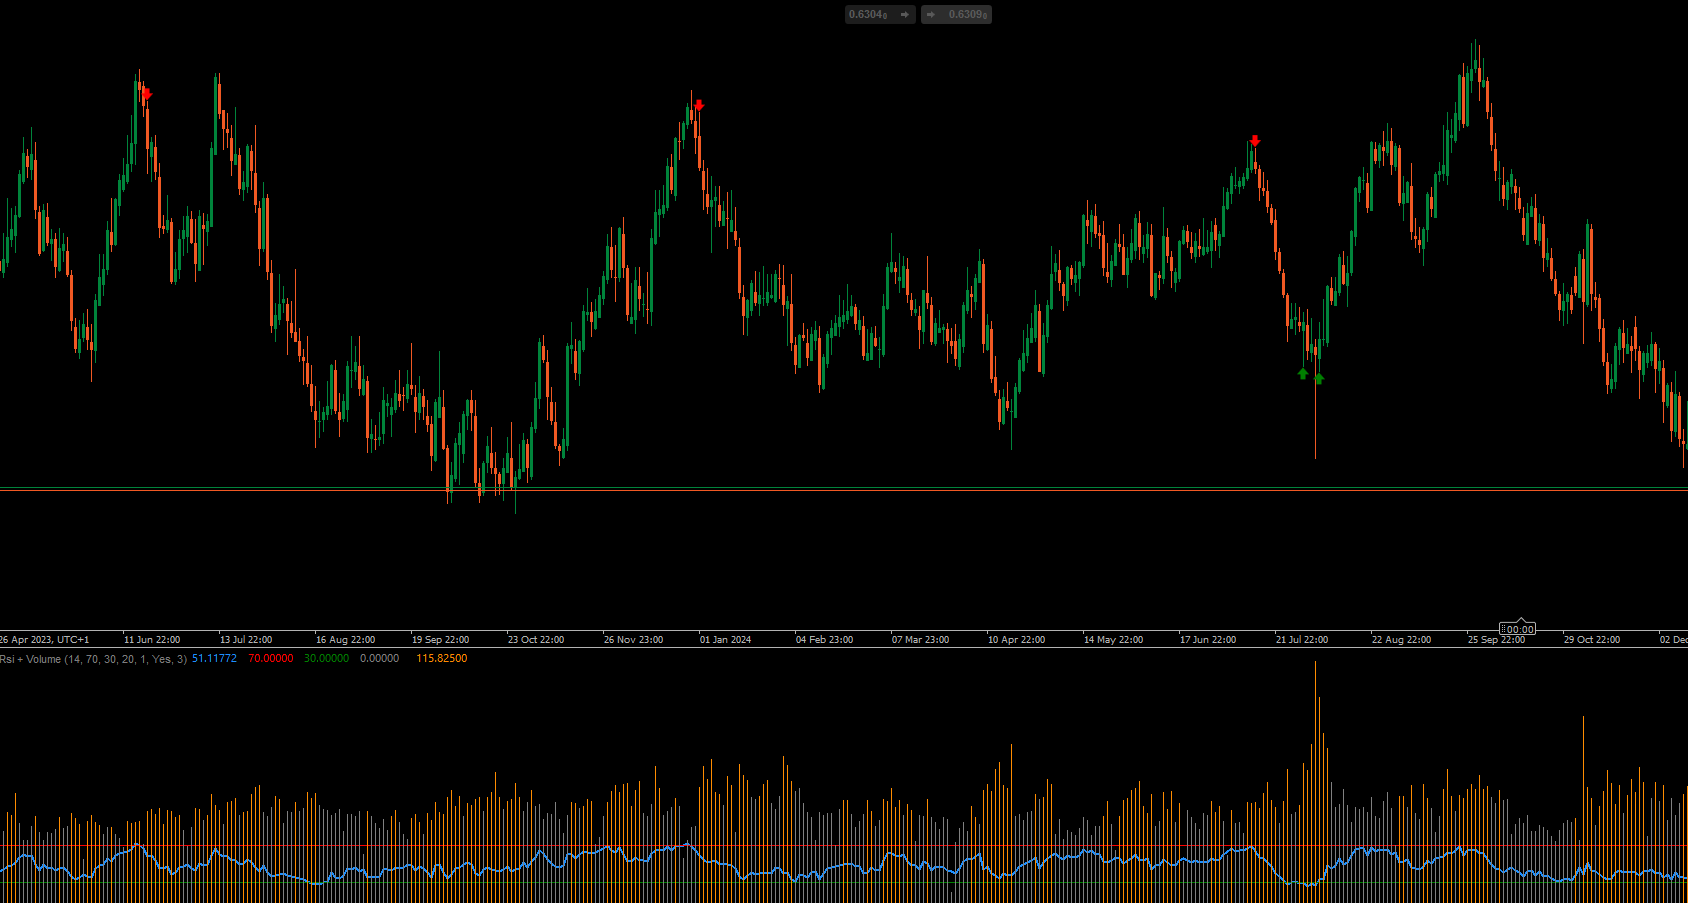
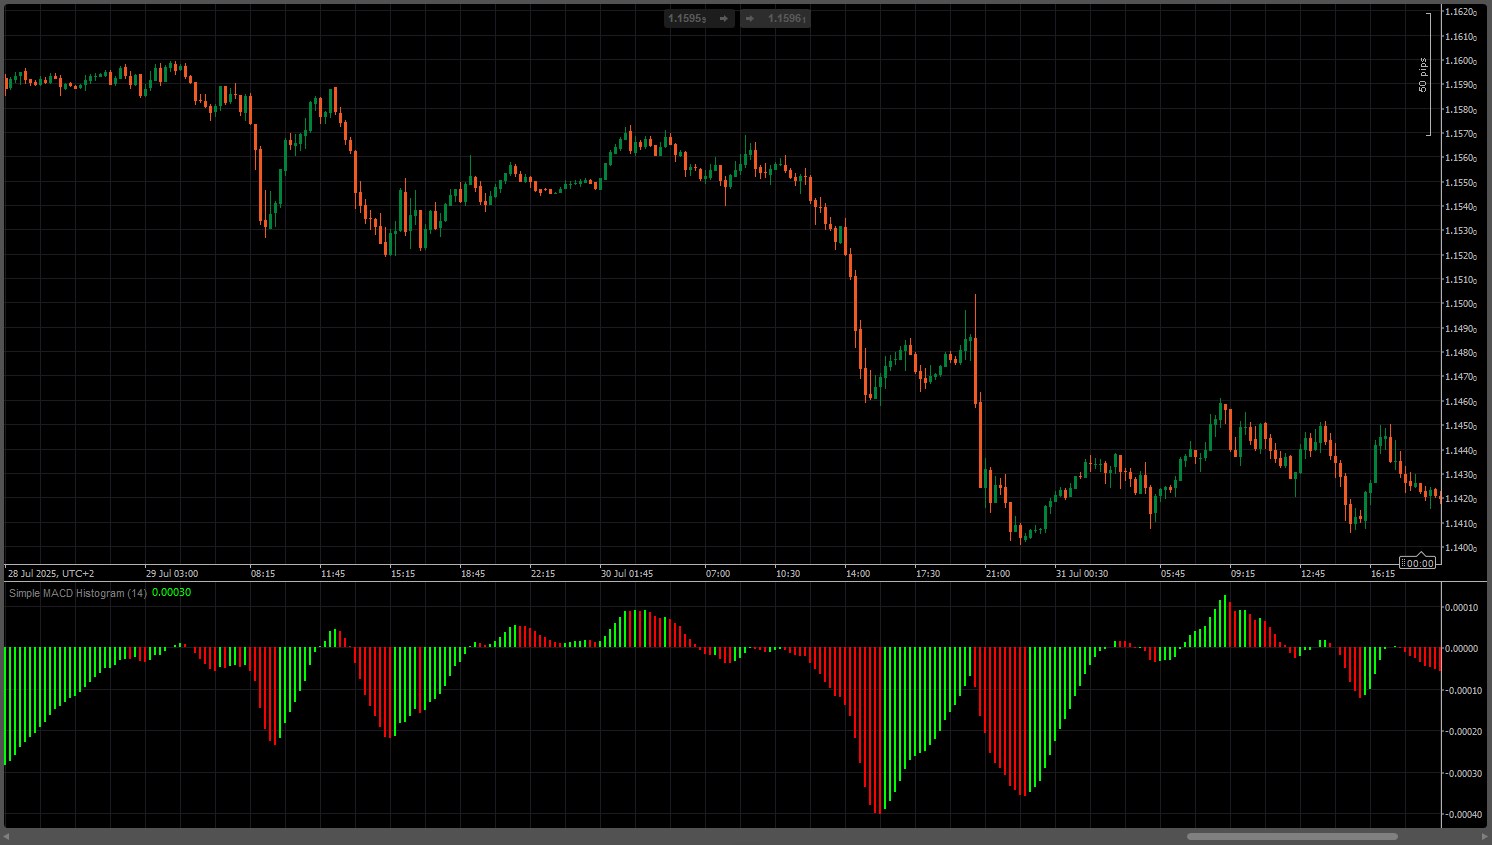
- Combining with Other Indicators: ZLEMA works well when combined with other technical indicators such as RSI, MACD, or price pattern analysis to enhance signal accuracy. It is especially useful when combined with trend-following indicators like moving averages to confirm price breakouts or reversals.
- Confirming Breakouts and Reversals: ZLEMA can help confirm price breakouts from key levels or reversal signals. For example, when the price crosses the ZLEMA line, it could indicate a trend change, and vice versa.
- Noise Reduction: Due to its reduced lag, ZLEMA is better at filtering out the noise that might be present in traditional moving averages, making it an important tool in intraday trading or highly volatile markets.
Tips for Using ZLEMA
- Adjust the Period: Adjust the period of ZLEMA based on your trading style and market volatility. For short-term trades, use a shorter period (e.g., 10 or 14), while for long-term trend tracking, a longer period (e.g., 50 or 100) may be more appropriate.
- Combine with Other Tools: While ZLEMA provides excellent trend-following capabilities, combining it with other indicators like RSI for overbought/oversold conditions or MACD for trend strength can improve accuracy.
- Testing and Optimization: ZLEMA’s performance may vary across different market conditions. It’s recommended to backtest and optimize it thoroughly before using it in live trading to ensure the best results in your strategy.
You may also like


Indicator
Forex
VegaXLR - Fibonacci Alerts
Alerts you when price touches Fibonacci levels. Stay organized and trade efficiently!