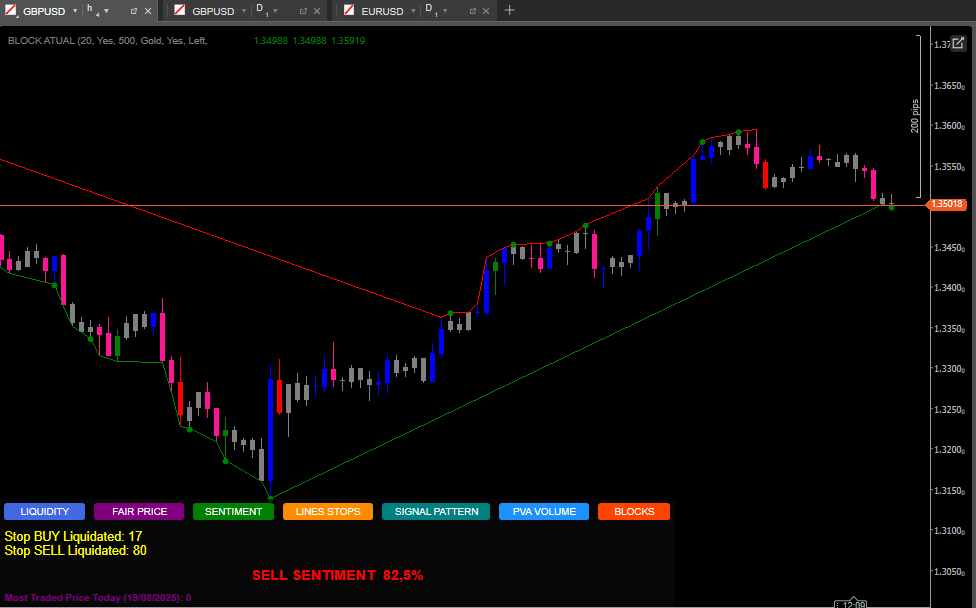
The MAGIC BLOCK STRATEGY indicator combines two main approaches to market analysis:
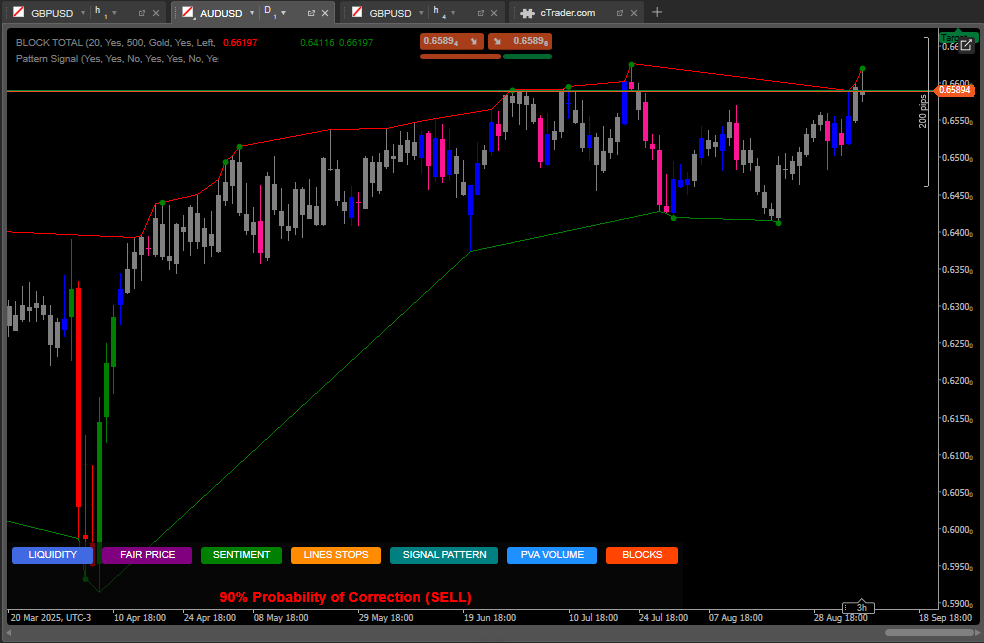
Order Block Detection:
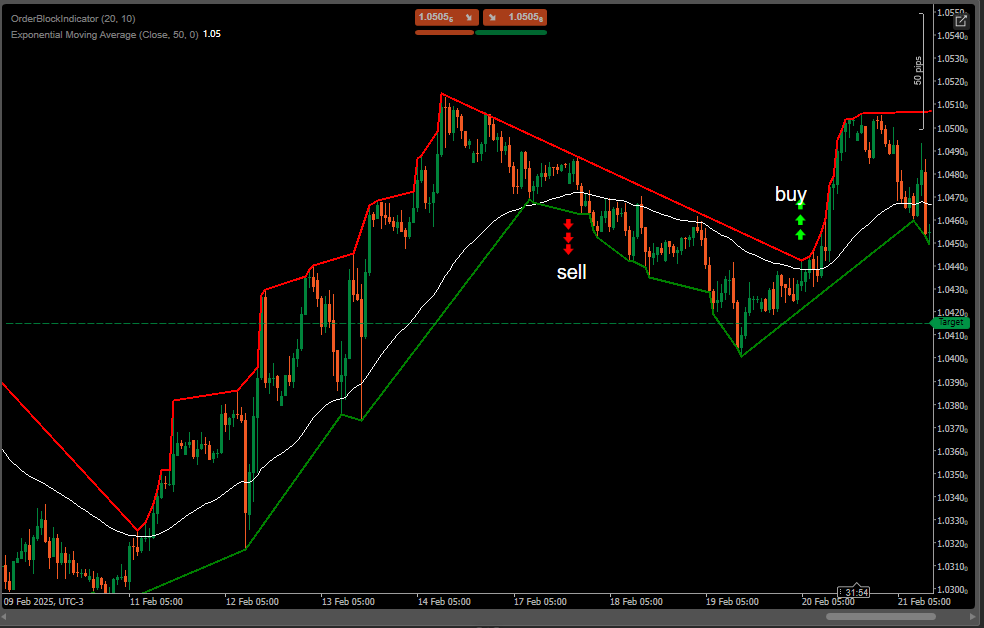
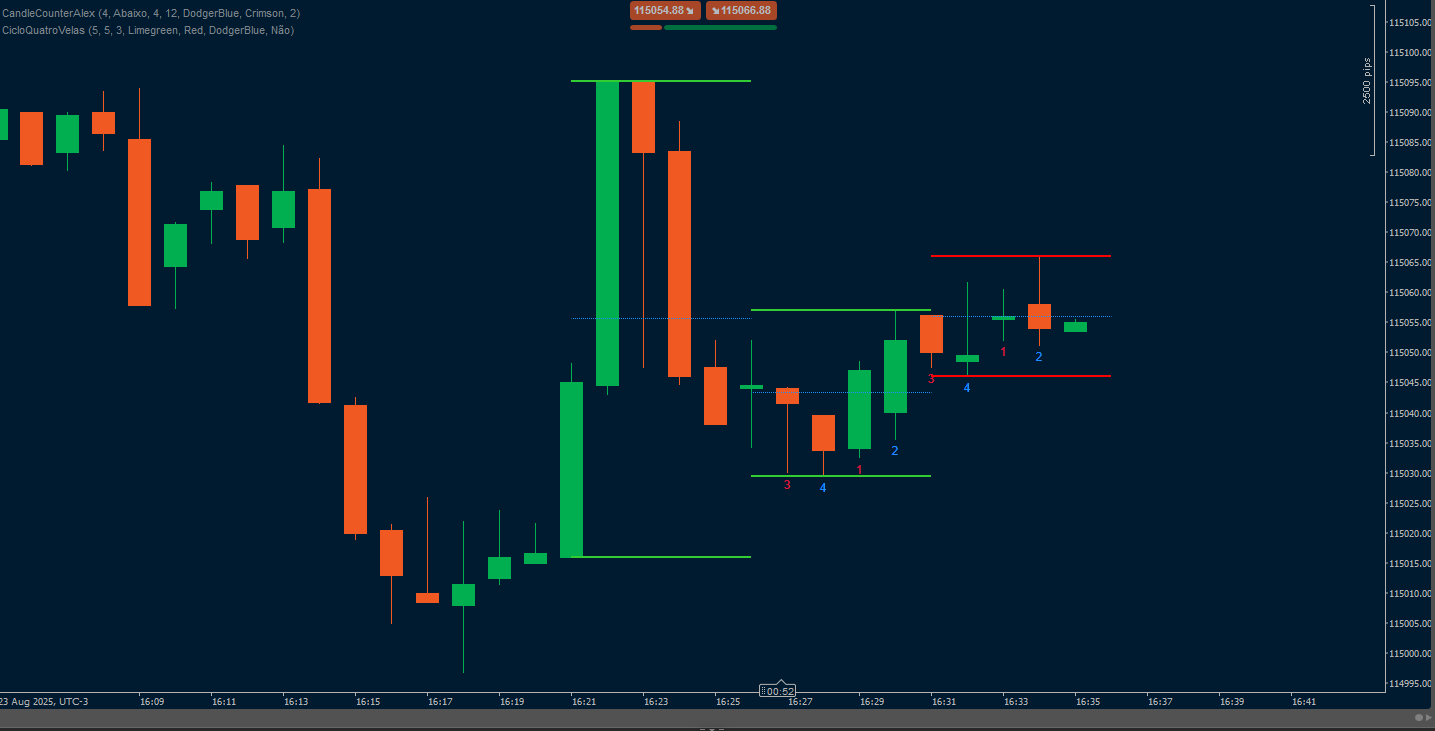
Identifies support and resistance areas based on unbroken highs and lows within a lookback period.
Generates buy signals when the price closes above an unbroken low.
Generates sell signals when the price closes below an unbroken high.
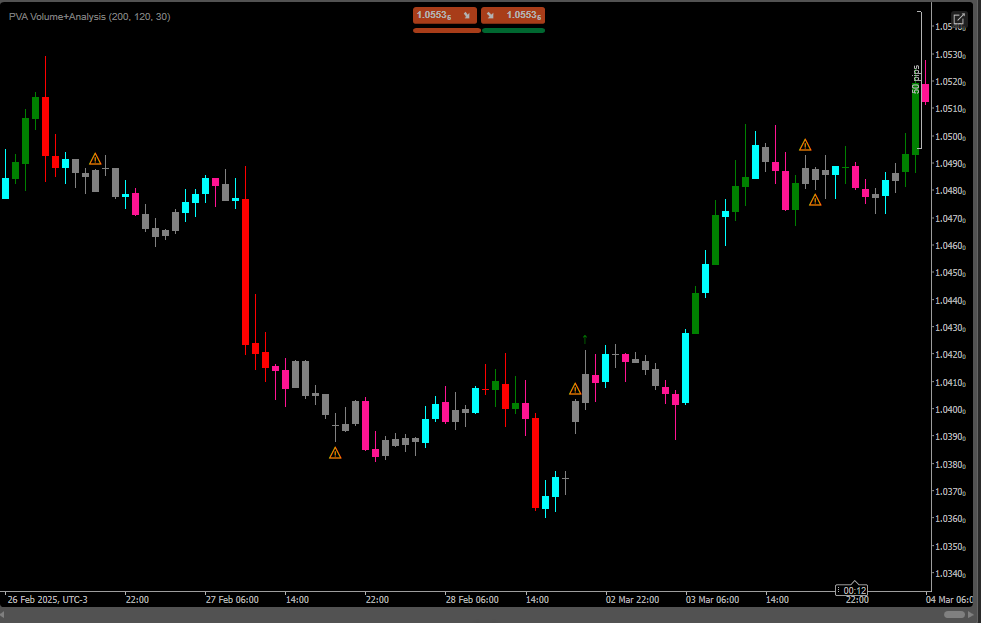
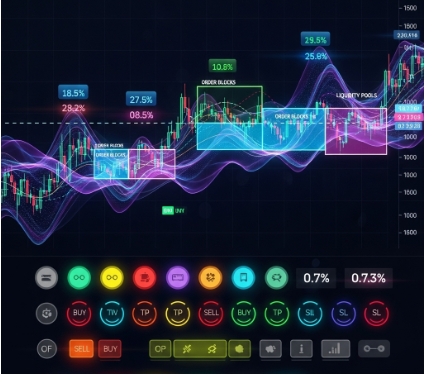
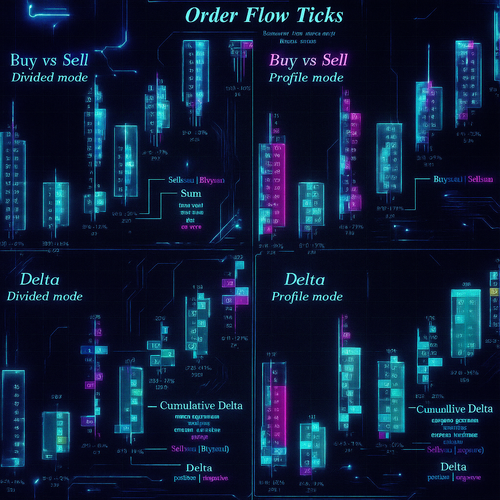
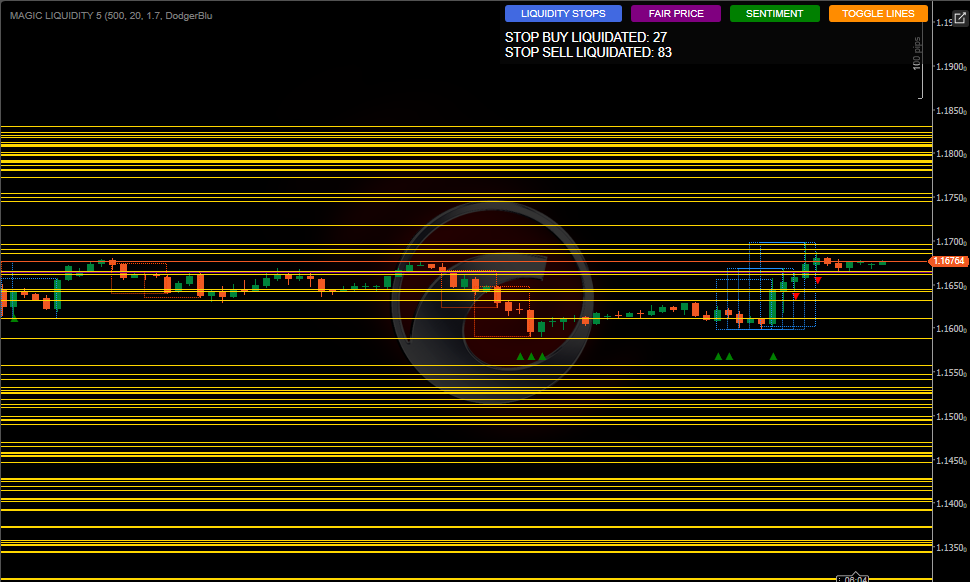
Liquidity Analysis:
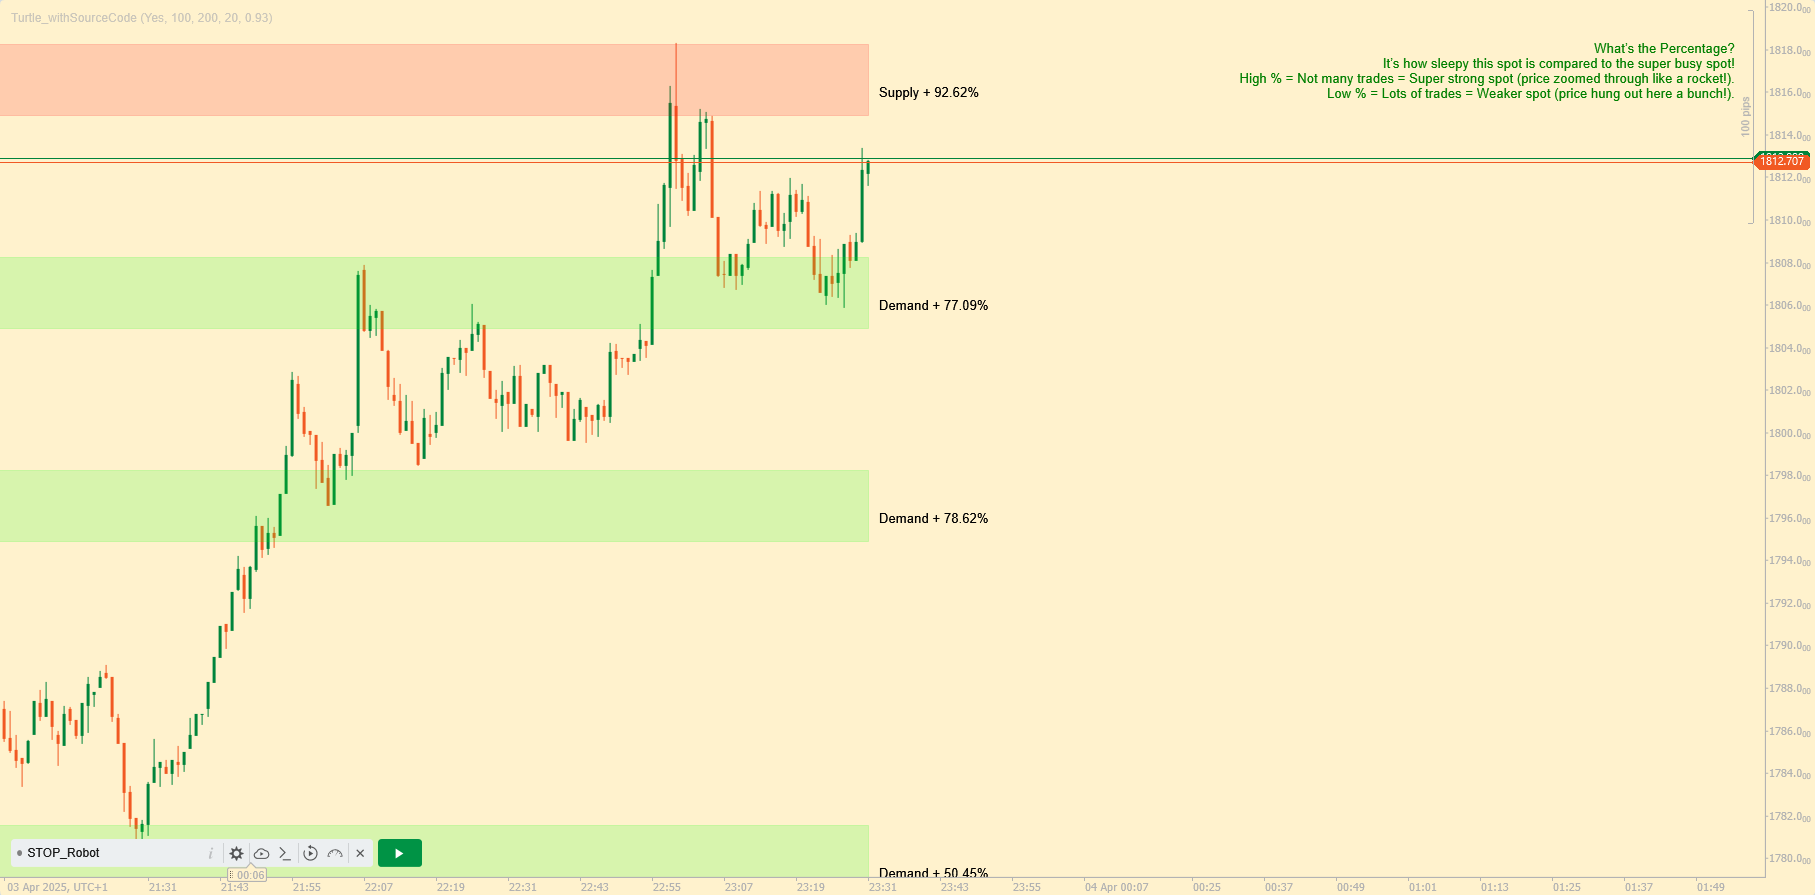
Detects liquidity pools areas where stop losses may be concentrated.
Monitors the activation of buy and sell stops.
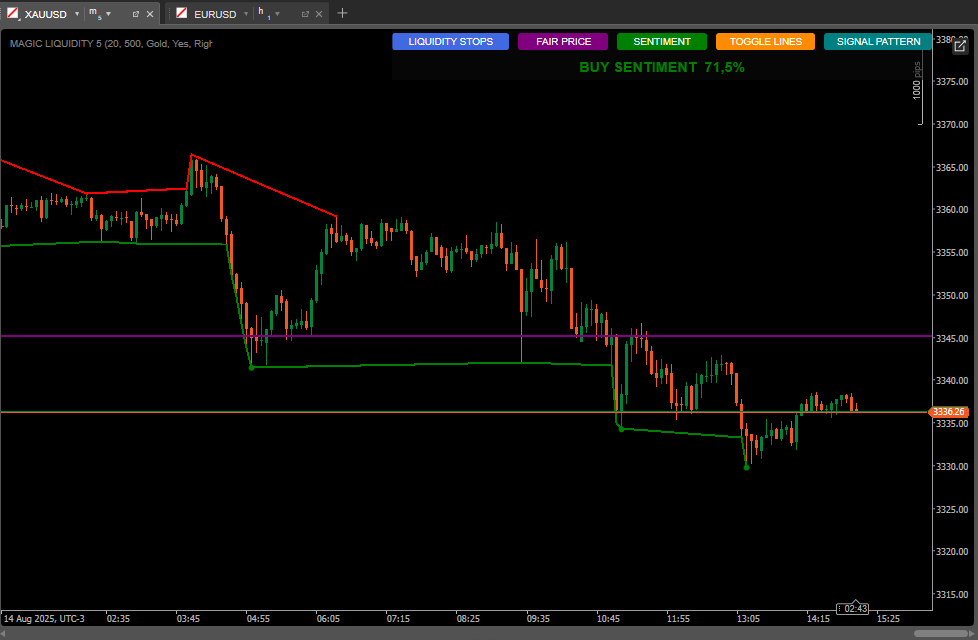
Calculates market sentiment based on liquidity distribution.
Identifies the most traded price fair price.
How to Use for Best Results
Initial Configuration
Lookback Period: Adjust the Lookback Period parameter according to the timeframe you are trading higher values for higher timeframes.
Number of Candles for Analysis: Keep it at 500 for robust analysis or reduce it for faster reactions.
Liquidity Pool Color: Choose a color that stands out on your chart.
Signal Interpretation
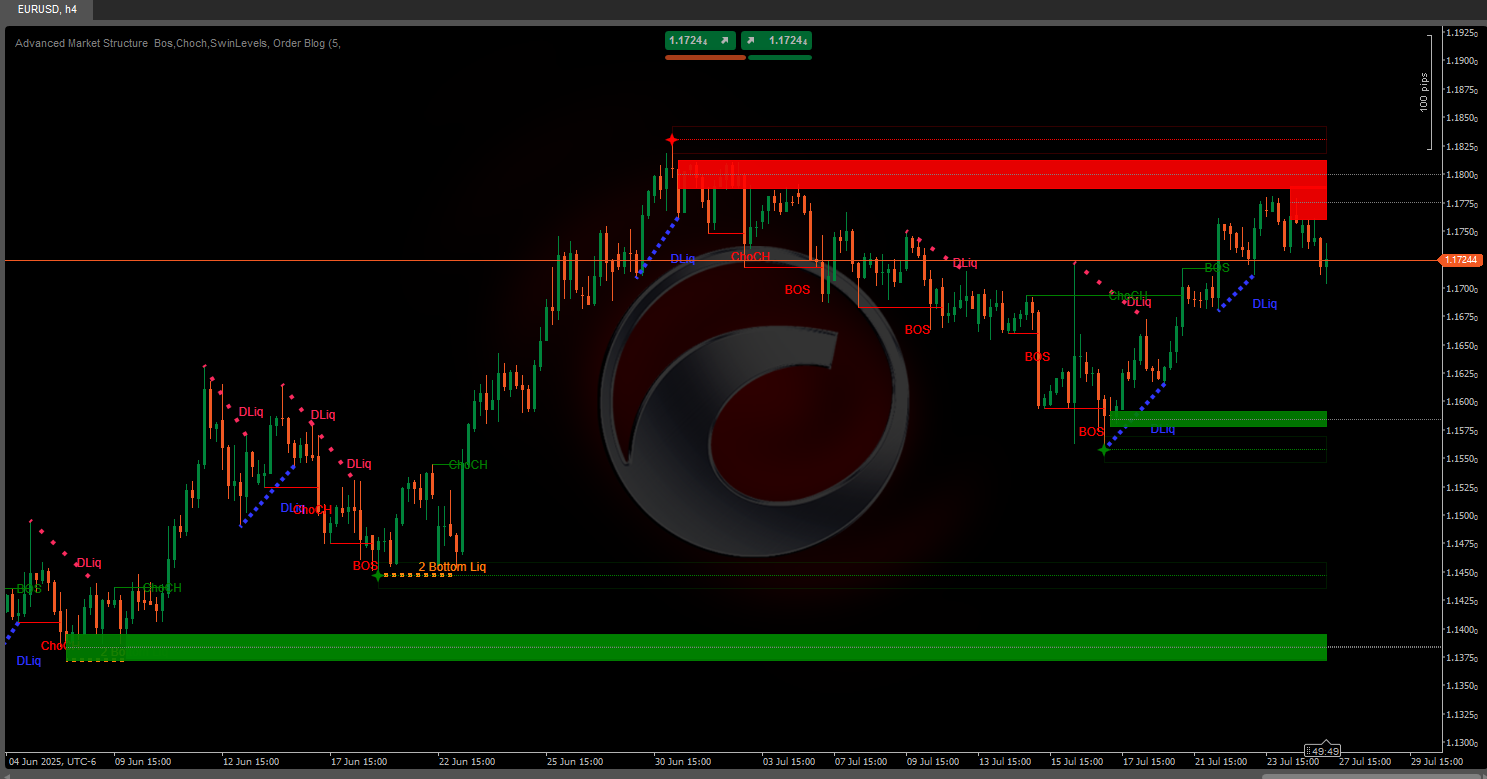
Order Block Signals:
Green dots: Buy signals when the price closes above an unbeaten low.
Red dots: Sell signals when the price closes below an unbeaten high.
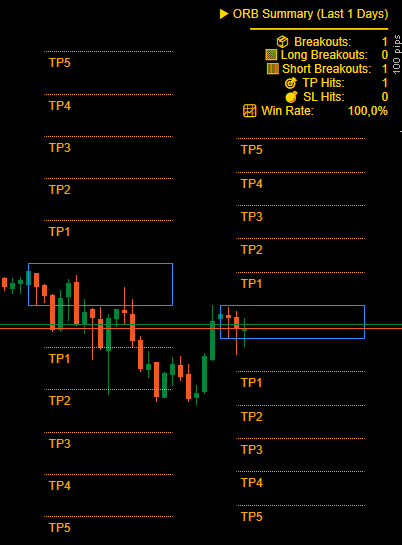
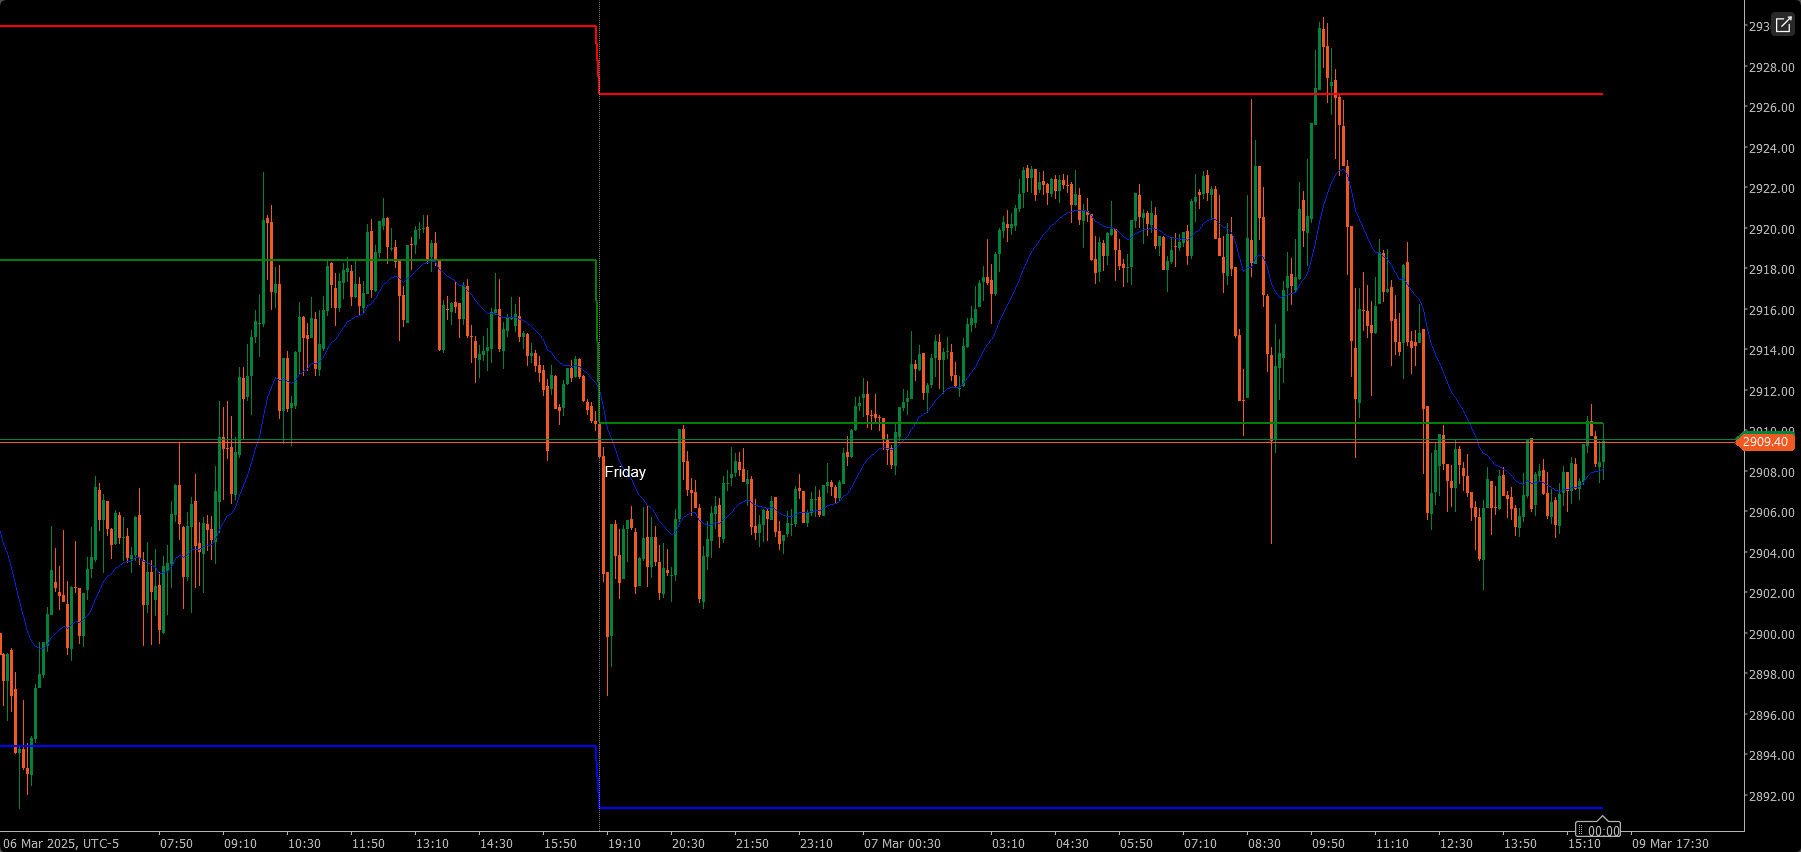
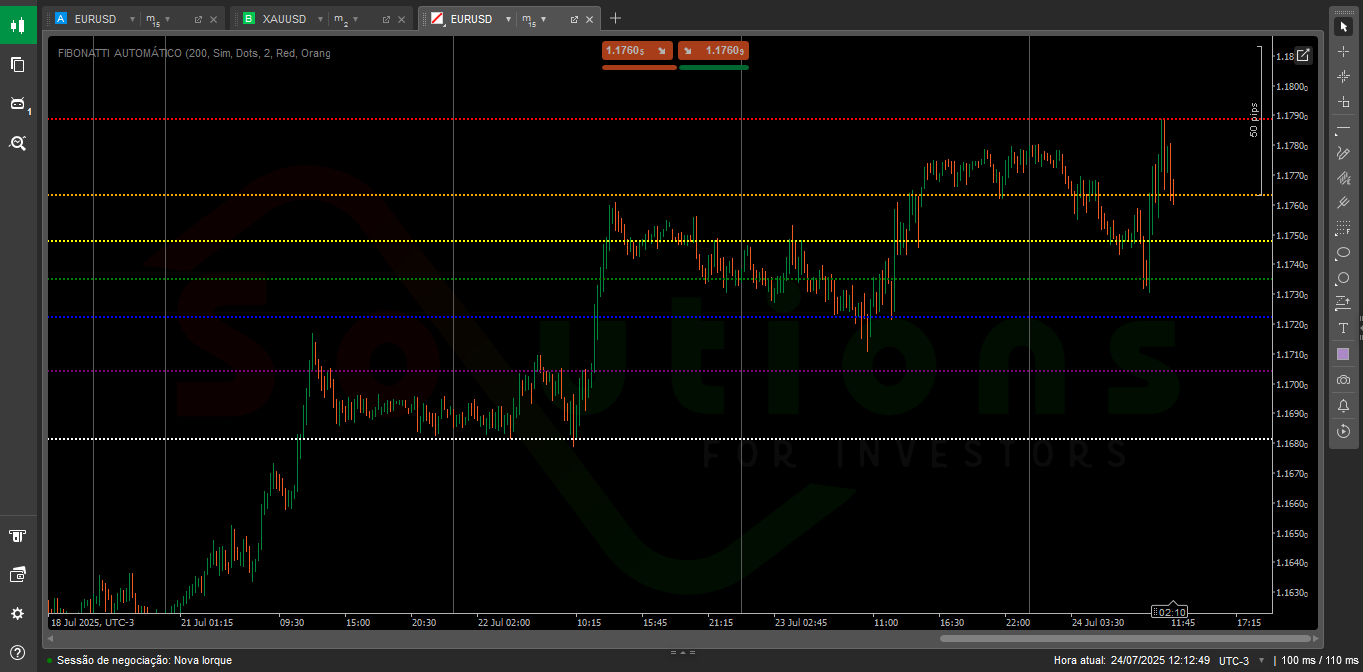
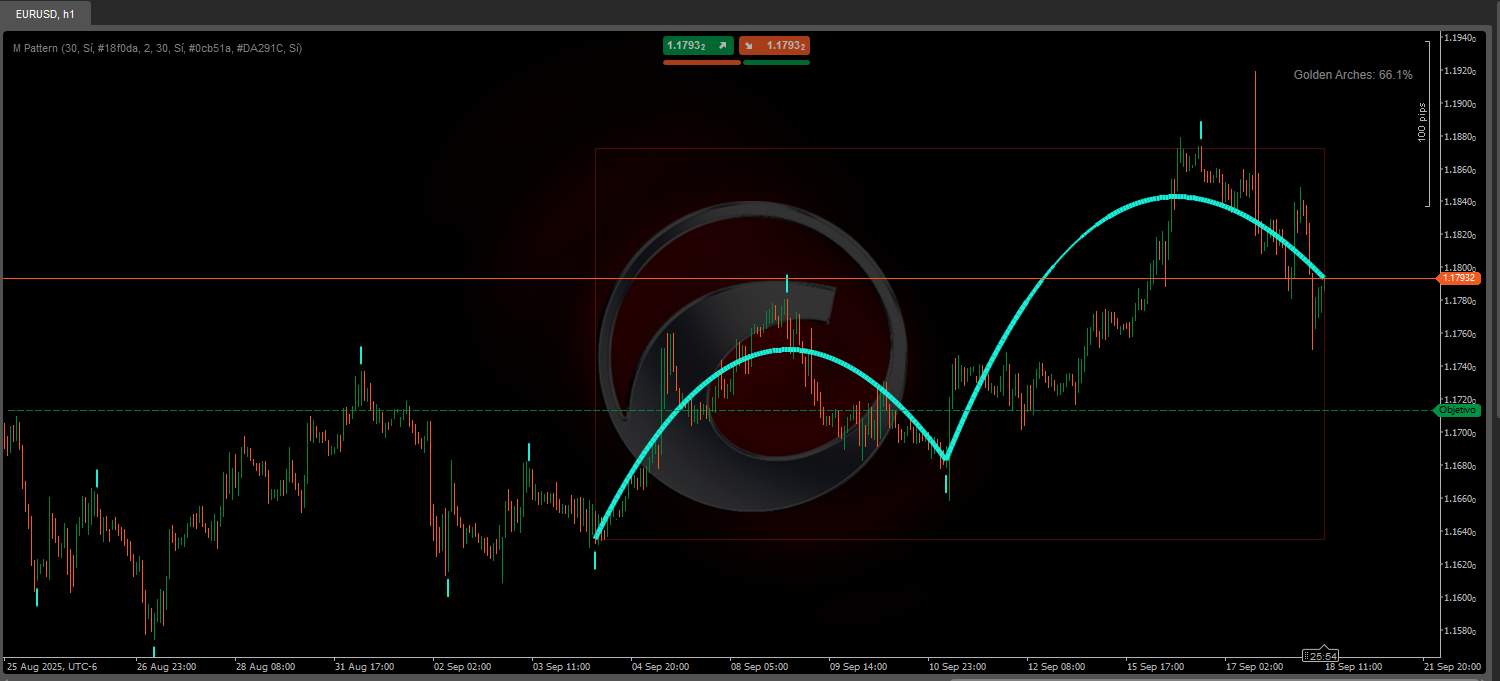
Liquidity Pools:
Horizontal lines show areas of liquidity potential targets or reversal points.
Monitor the relationship between liquidity above/below the current price.
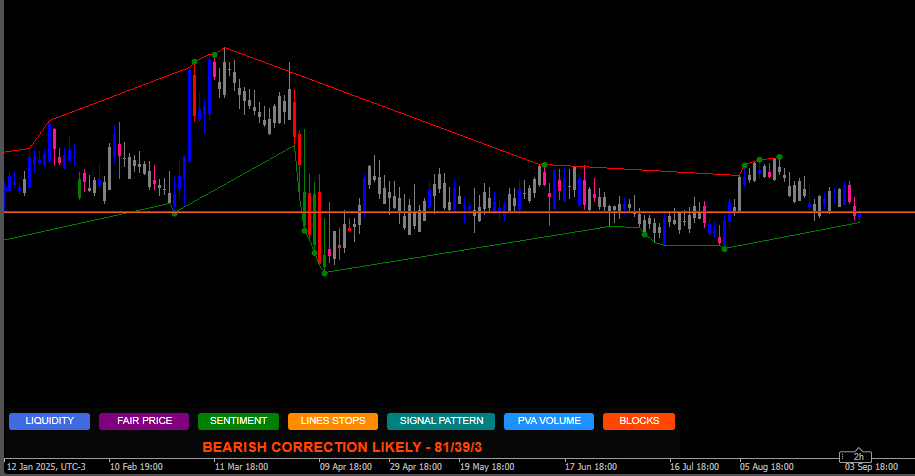
Market Sentiment:
Use the SENTIMENT button to see the prevailing direction and confidence.
Buying sentiment with high confidence suggests continued growth. High-confidence sell sentiment suggests bearish continuation.
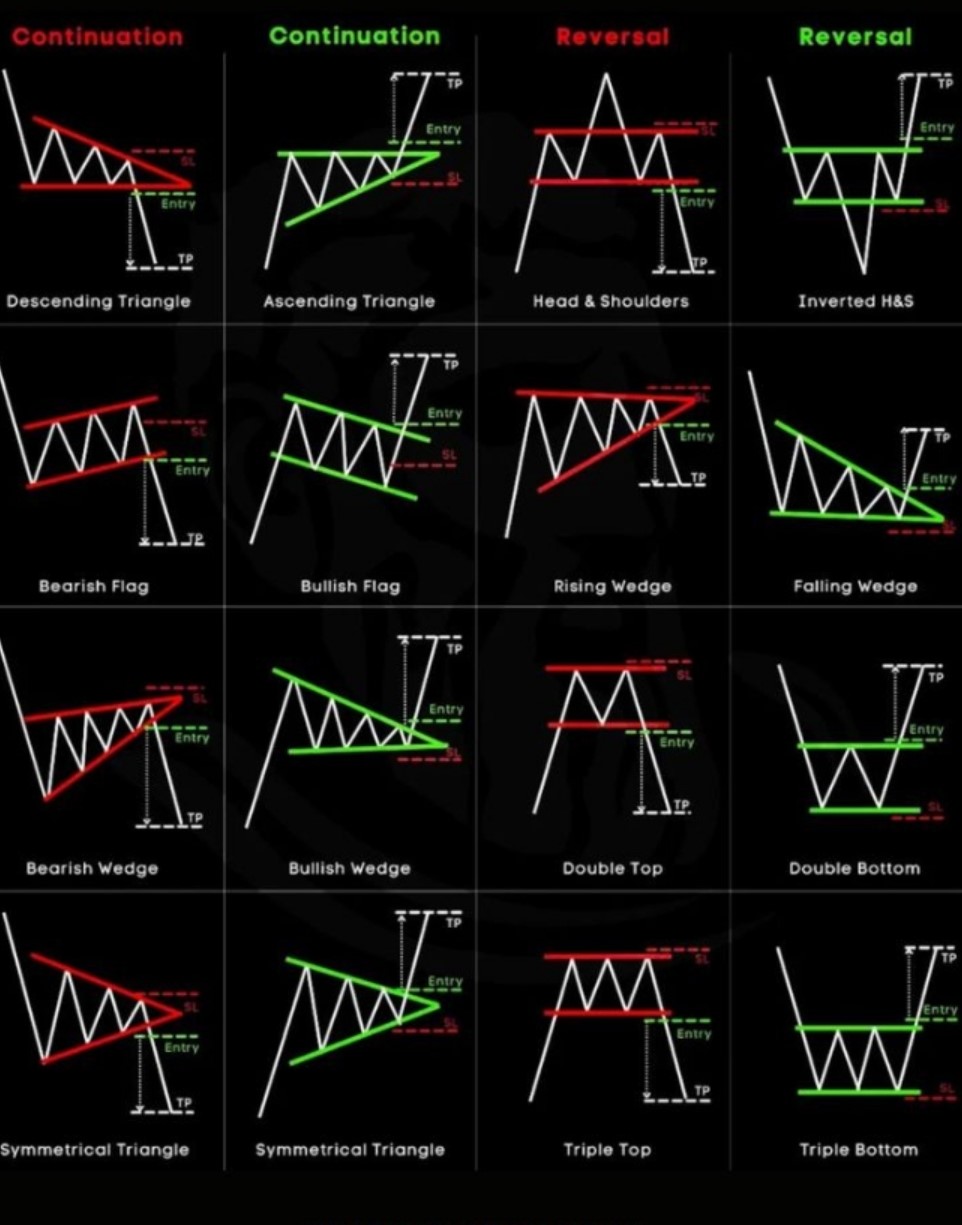
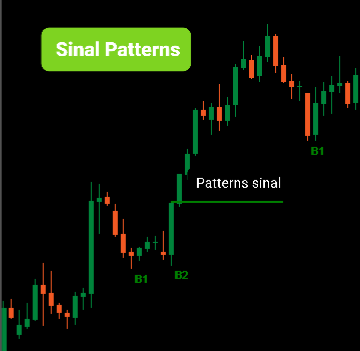
Candlestick Patterns:
The SIGNAL PATTERN button analyzes and
Shows correction probabilities based on the quantitative ratio
Most Traded Price Fair Price:
The PRICE button shows the price level with the highest volume of the day.
It can act as a magnet for prices or as support/resistance.
Usage Strategies
Conservative Strategy:
Trade only when order block signals coincide with prevailing sentiment.
Use liquidity pools as take-profit targets.
Aggressive Strategy:
Anticipate reversals when the price approaches liquidity pools with many accumulated stops.
Use divergences between sentiment and price action for counter-trend trades.
Additional Confirmation:
Compare with the candlestick pattern shown by the indicator.
Check if the fair price is nearby as an area of interest.
Risk Management.
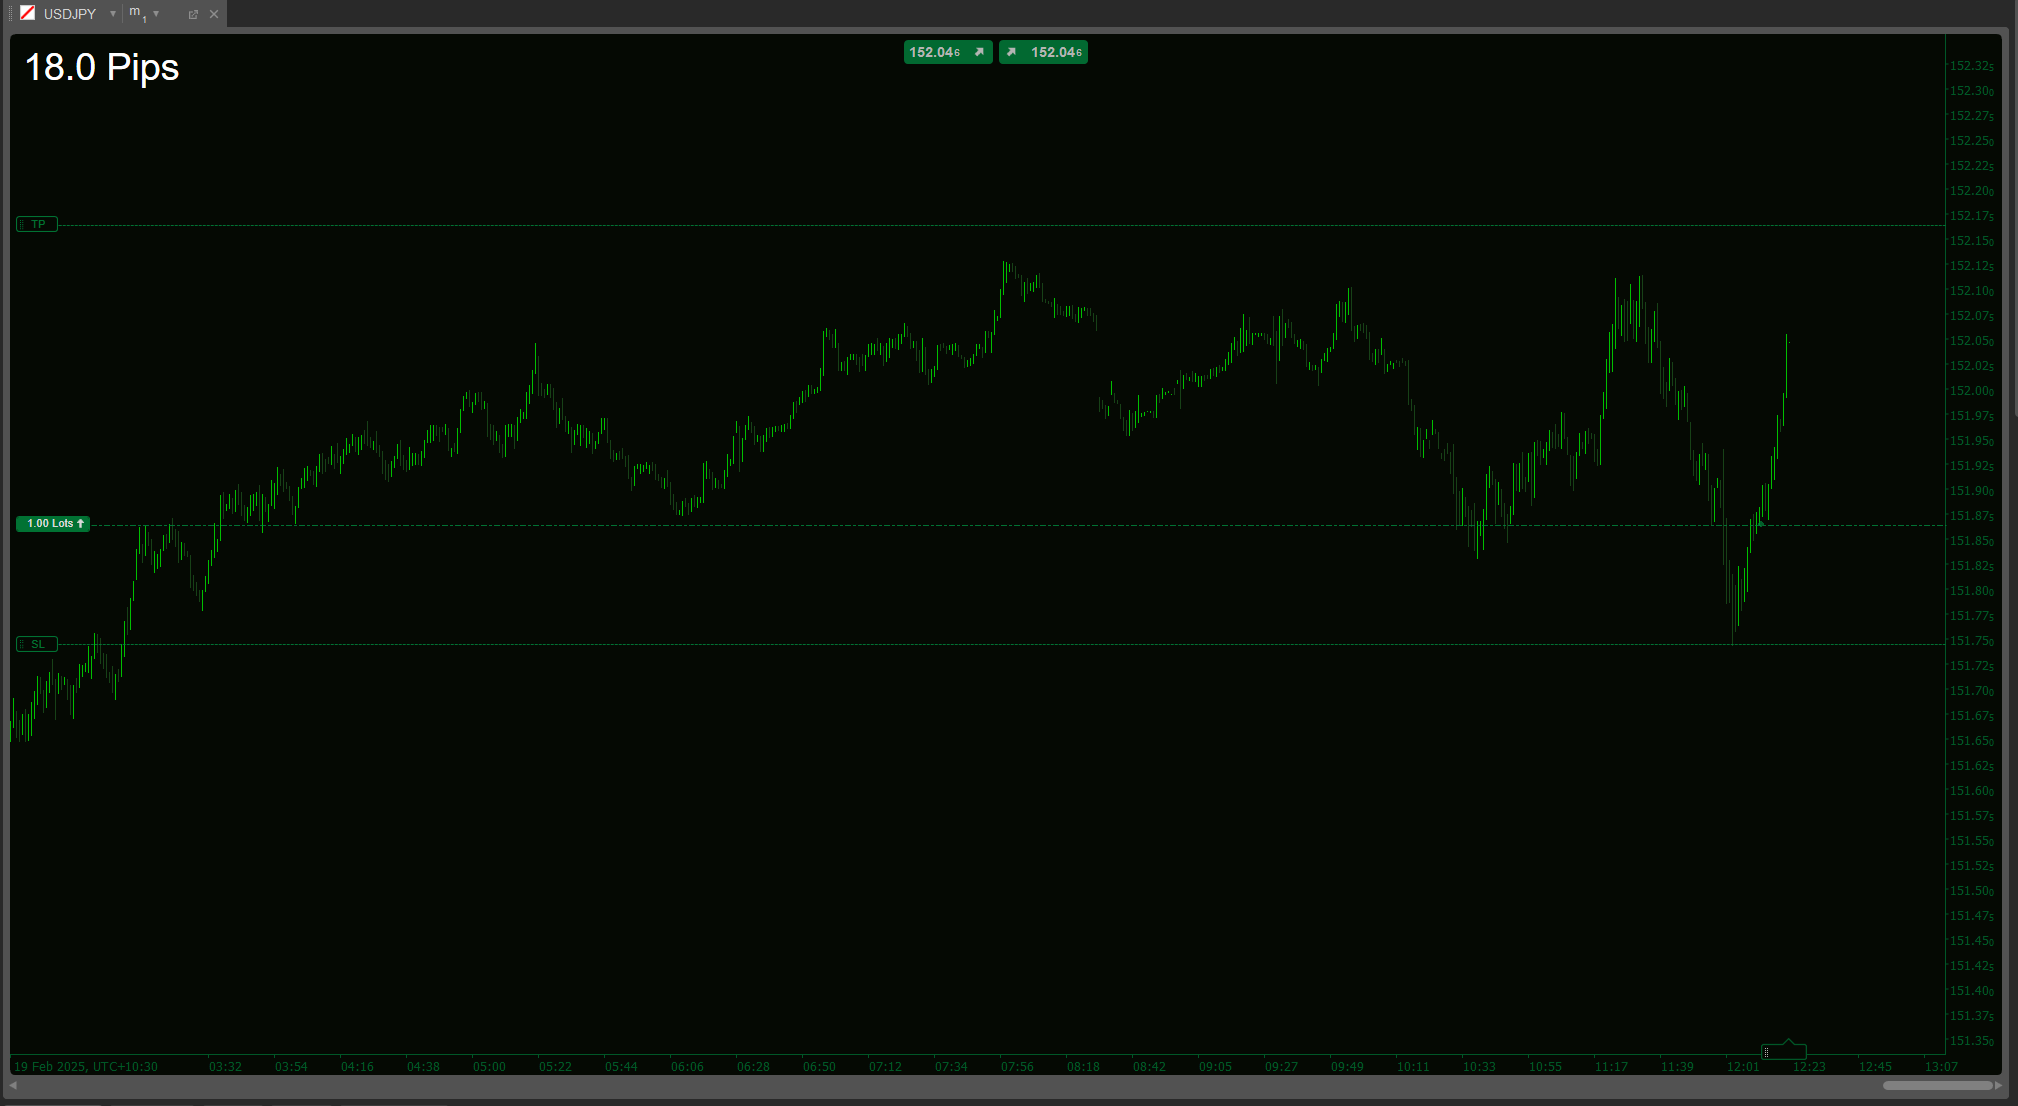
Stop-Loss:
Place below the most recent order block for buys
Place above the most recent order block for sells
Take-Profit:
Targets in nearby liquidity pools
Consider the above/below liquidity ratio to set targets
Advanced Tips
Use the TOGGLE LINES button to disable liquidity lines when the chart becomes cluttered
Monitor the count of liquidated stops to assess the strength of the move
Fair price is especially useful in range-bound markets such as dynamic support/resistance
Combine with other indicators for confirmation volume, moving averages
SIGNAL PATTERN AVAILABLE IN THE D1 TIMEFRAME.
https://ctrader.com/pt/products/1725?u=Goulart
https://ctrader.com/pt/products/1386?u=Goulart