Indicator
forex
indices
gbpusd
commodities
xauusd
nas100
nzdusd
prop
btcusd
eurusd
usdjpy
crypto
stocks
"Tsunami Volume Surge - RVOL" logo
Tsunami Volume Surge - RVOL
0.0
07/09/2025
0
Desktop

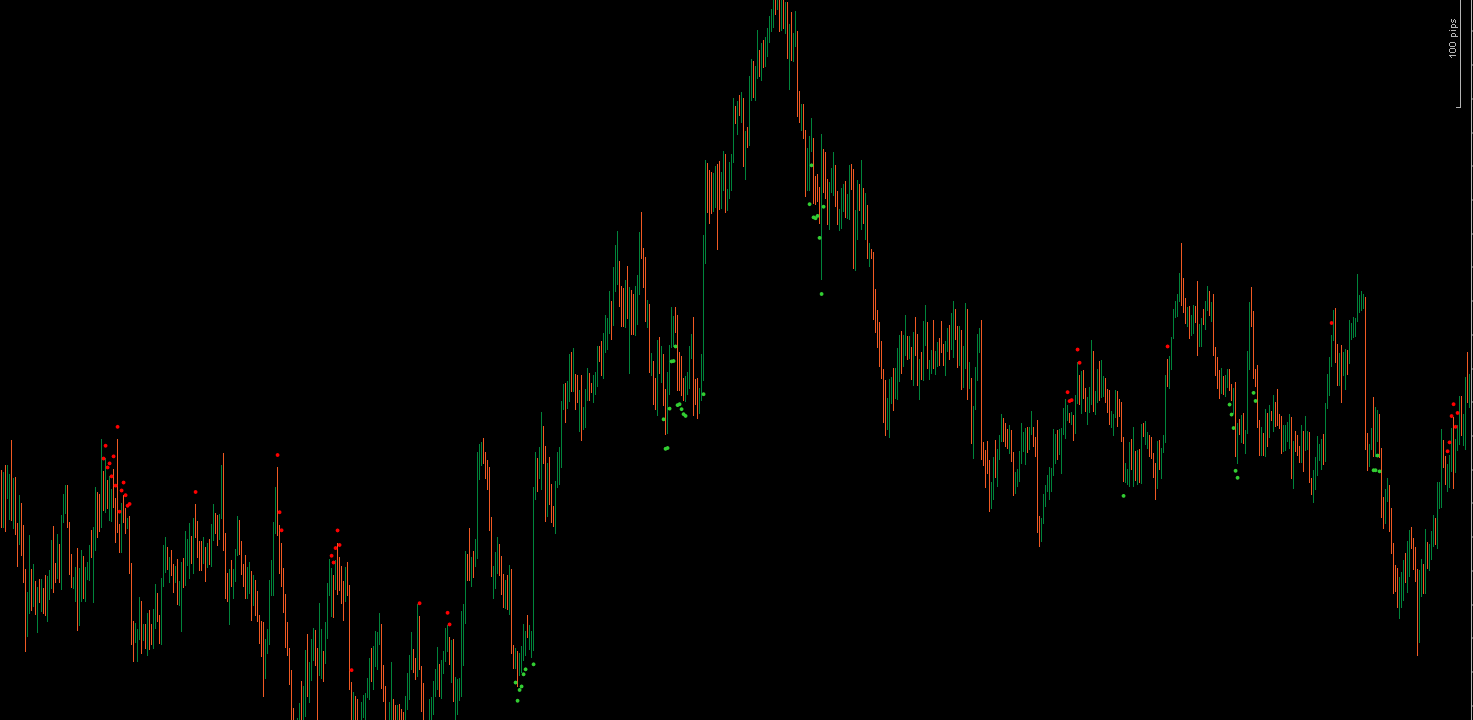
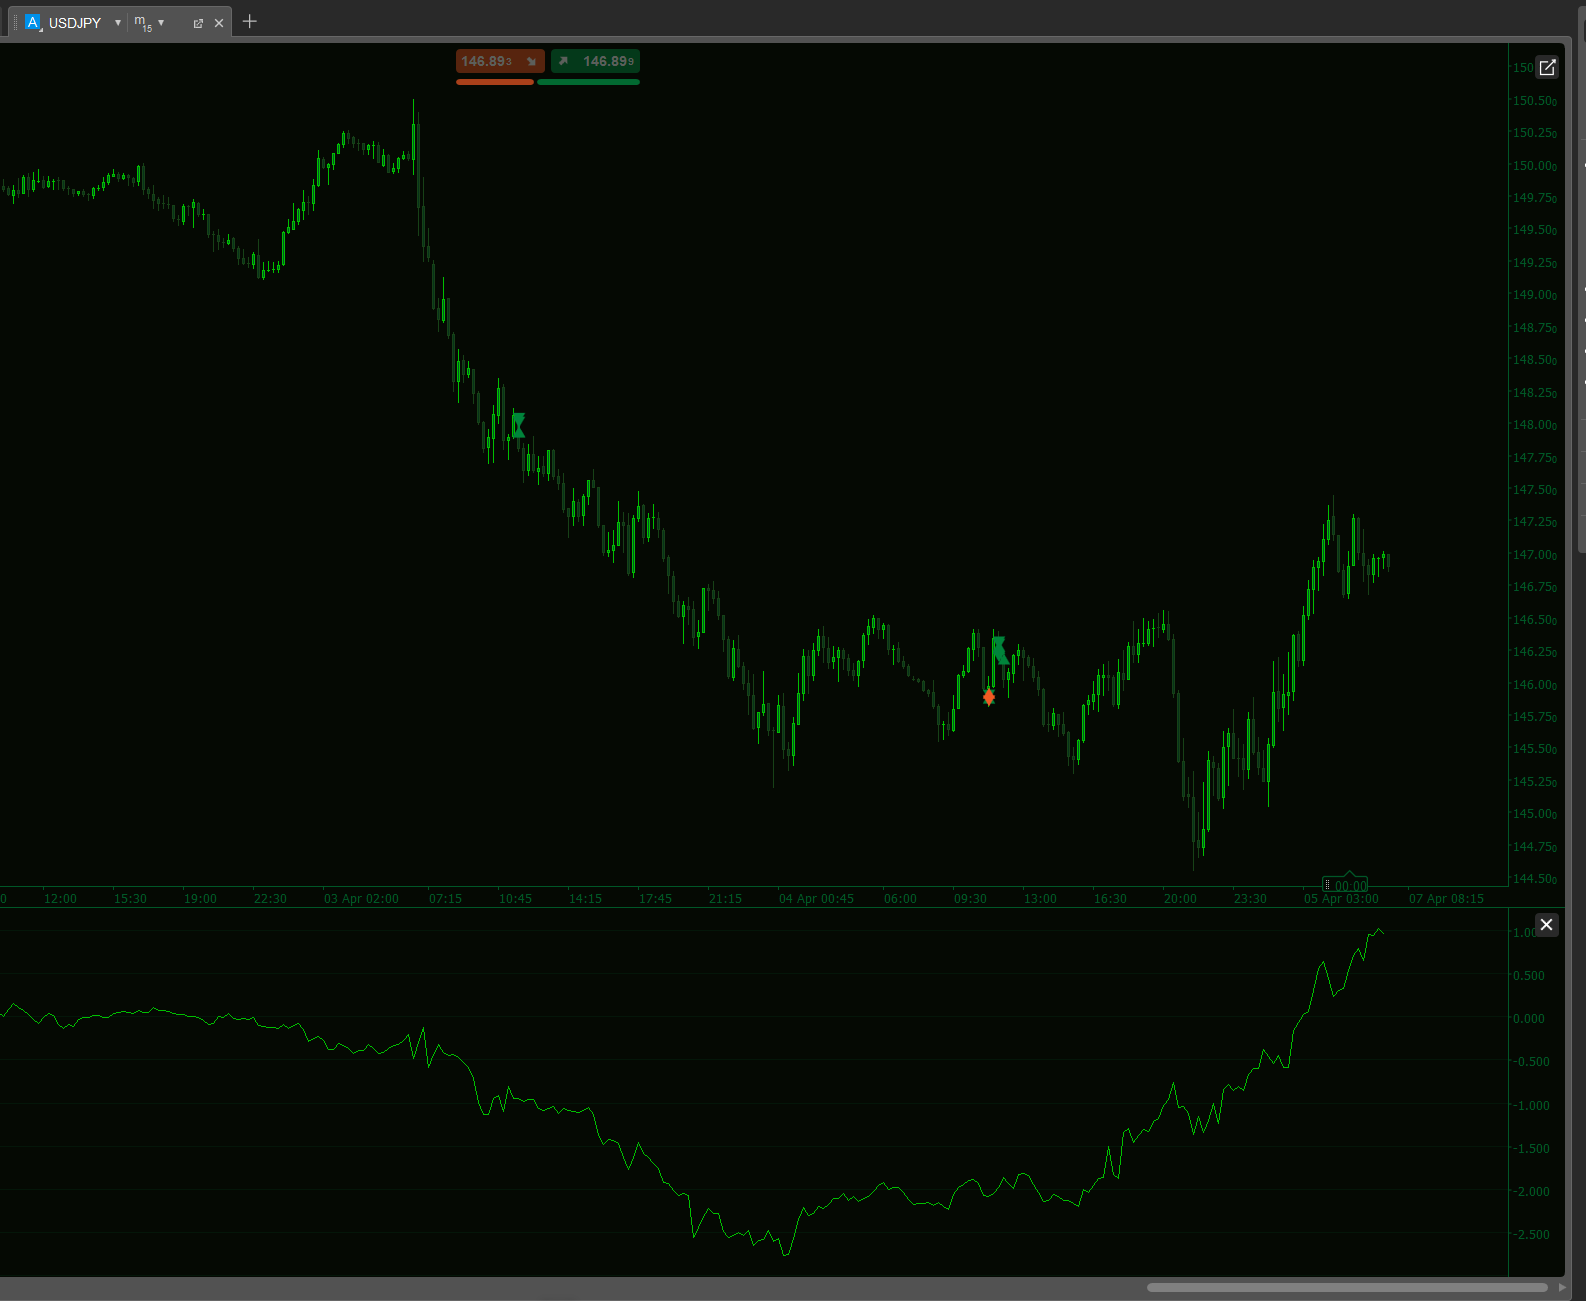
🌊 Tsunami Volume Surge(RVOL + Time-of-Day) is a cTrader indicator designed to show traders when the market is truly active. Instead of looking only at absolute volume, it compares current market activity with its usual levels at the same time of day.

The main idea is simple: if volume is significantly higher than normal, the move is more likely driven by real market participants and has greater strength. The indicator highlights these situations using a color-coded histogram, bar coloring on the chart, and convenient alerts.

📊 How to use 

There are many ways to use Tsunami Volume Surge:

Visual confirmation
Colored candles make it easy to see which bars have real energy behind them, without staring at numbers.ts.

Filter weak signals
If volume is below normal (RVOL < 1.0), the market lacks interest. Avoid signals during such conditions.

Confirm breakouts
A breakout supported by high RVOL is far more reliable than one on low volume. Quasar Volume helps you spot the difference.

Time-of-day analysis
Different markets have their own rhythm. This indicator shows at which hours a symbol usually becomes active.

News trading
During major news events, RVOL often spikes. Setting a higher threshold (e.g. 3.0) helps you catch these explosive moves.


✅ Main Features

  • Automatic Relative Volume (RVOL) calculation — instantly shows when market activity is above or below its usual level.
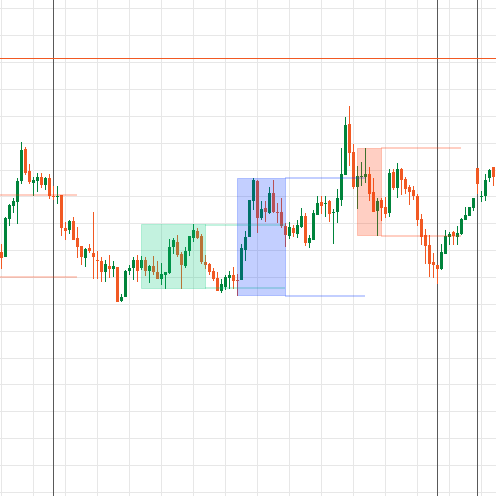
  • Color-coded histogram — clear visual separation of low, normal, and high volume bars.
  • Dynamic candle coloring — bars are tinted based on strength of volume; the bigger the surge, the stronger the highlight.
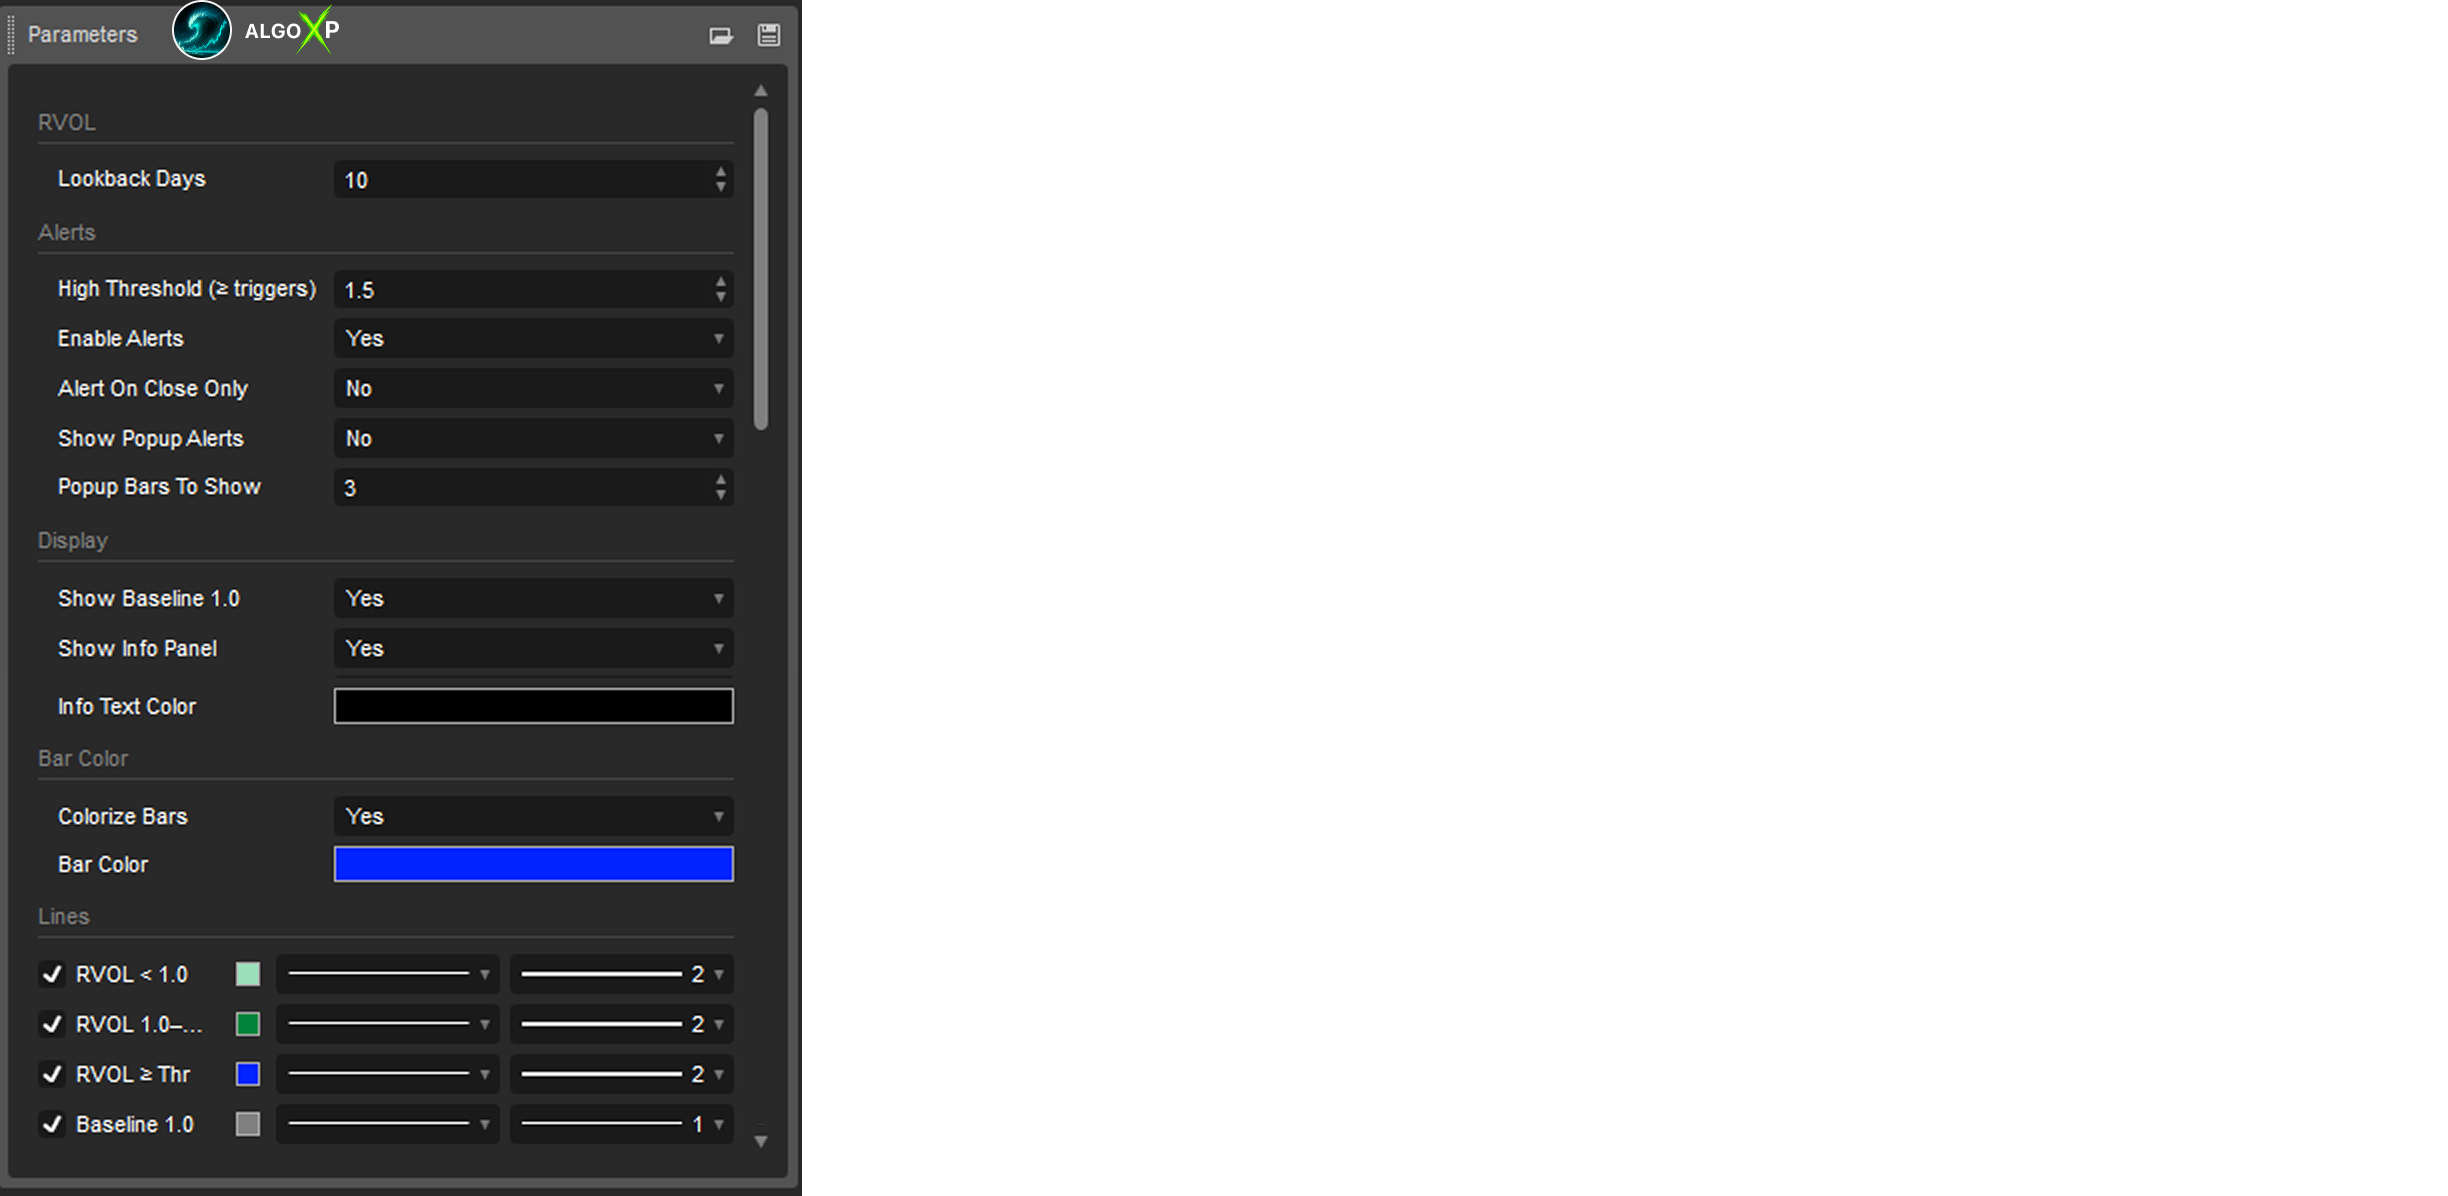
  • Configurable thresholds — set your own sensitivity (e.g. 1.5 for scalping, 3.0 for news trading).
  • Alerts & pop-ups — get notified when volume crosses your chosen threshold, with time and date.
  • Info panel — displays live RVOL values, averages, and settings at a glance.
  • Baseline line (1.0) — quick reference to normal activity levels.
  • Lightweight and fast — designed to run smoothly even on low timeframes (M1, M5).

🎯 Perfect for

  • Algo developers — RVOL values can be used as a filter or condition in automated cBots.ar shading make the trend easy to read.
  • Scalpers — confirm if a breakout or micro-trend has real strength behind it.
  • Intraday traders — identify the most active times of day and avoid quiet periods.
  • Swing traders — filter false moves and focus only on breakouts with strong participation.
  • News traders — instantly see volume spikes during economic releases and react faster.
  • Beginner traders — simple and intuitive visuals make it easy to understand when the market is “alive” or “dead”.
More from this author
Indicator
forex
prop
usdjpy
JPY Samurai Breakout Lite
⚔️ JPY Samurai Breakout Lite — Simple Breakout Indicator for cTrader ⚔️
Indicator
forex
breakout
prop
+1
JPY Samurai Breakout Pro
⚔️ JPY Samurai Breakout Pro — Professional Breakout Indicator for cTrader ⚔️
cBot
forex
prop
commodities
+3
Maya Gold Grid ATR - TEST VERSION
🌞 Maya Gold Grid ATR is a professional trading robot designed exclusively for XAUUSD (Gold) on the cTrader .🌞
Indicator
forex
indices
gbpusd
+10
Nebula Range Filter Pro
⚡Nebula Range Filter is a professional trend filter indicator for cTrader⚡
cBot
forex
prop
xauusd
+3
Maya Gold Grid ATR
🌞 Maya Gold Grid ATR is a professional trading robot designed exclusively for XAUUSD (Gold) on the cTrader .🌞
You may also like
LT_FairValueGap
Detects valid Fair Value Gaps from strong 3-bar patterns. Keep drawing unfilled gaps until price fills them.
Indicator
rsi
signal
Wyckoff Toolkit [Iridio Capital]
The Wyckoff Toolkit is the ultimate ally for traders seeking to decode the market through the lens of "smart money."
Zig zag v.1
ZigZag Pro – Multi-Swing Indicator for cTrader Description: ZigZag Pro is a powerful and fully customizable swing indica
Indicator
eurusd
gbpusd
nas100
Ema
An exponential moving average based on regular trading hours.
Fibonacci Pitchfan
Powerful all-in-one tool for traders seeking a clear, dynamic view of market structure. By merging pivots, trendlines &
4MA
This indicator consists of 3 moving averages that can be configured to your liking, from the type of moving average....
Clarosti
Clarosti a chave para decisões inteligentes no mercado
Indicatore livelli numeri tondi_fabio23.traders
Indicatore dei livelli numeri tondi sul grafico , regolabile.Indicator of levels round numbers on the graph, adjustable
Indicator
forex
vwap
rsi
+2
Market Cipher B
Market Cipher B
Indicator
bollinger
commodities
rsi
+1
Dot Momentum %BB Indicator
Dynamic circles visualize price's volatility position. Like RSI for market overextension & stretch. Quantify context.
Indicator
commodities
xauusd
True Open Pivot Levels
This indicatorFull Description: Th shows the open price lines at key market times based on Eastern Standard Time (EST).
Open Trade PipsV1
This indicator tracks the unrealised amount of pips in your open positions.
Indicator
supertrend
atr
PMAX
It's a combination of two trailing stop loss and the other one is well-known ATR-based SuperTrend.
Quantitative Qualitative Estimation
The QQE (Quantitative Qualitative Estimation) Weighted Oscillator improves its original version by weighting the RSI.
CursorbyteAutoFib v2
Draw Fibonacci on the current day, previous day, current week, and previous week on all charts.
Ctrader Liniar Chart
Simple and efficient Indicator Designed to be profitable .With alarms for trend changes and support - resistance
MM-HTF Bars
Shows bars from different TimeFrame on zoom out and hides the current bars. Perfect tool for Multi TF "Market Reply"
Indicator
scalping
Grafico Diario
Bússola para Decisões de Trading Precisas e Eficientes!