
Description
MarketSessions – Your Trading Edge, Visualized
Turn Market Time Into Trading Power
MarketSessions is a professional-grade cTrader indicator that brings global market sessions to life — so you can trade where momentum is real and timing becomes your edge.
🚀 Why Traders Trust MarketSessions
See the Market Rhythm
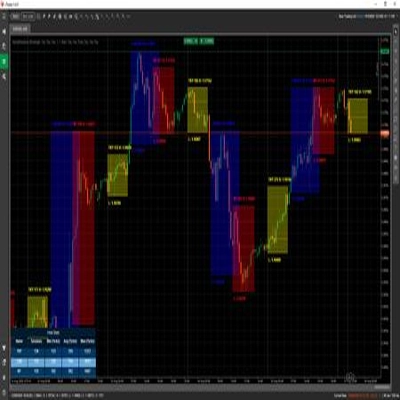
Instantly visualize London, New York, Tokyo, Sydney – and any other session you want – with clean, elegant overlays that adapt to your chart.
Trade Smarter, Not Later
Get real-time notifications when sessions open, close or reach key levels – delivered through Telegram or Discord (your choice).
Attack High-Probability Zones
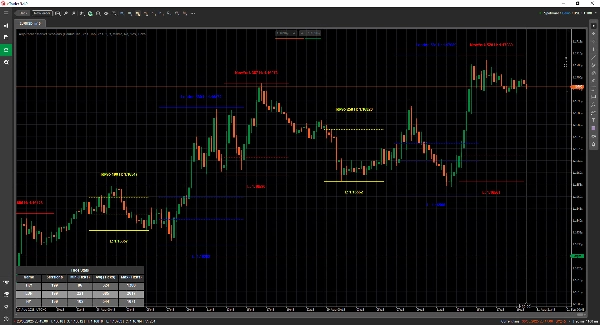
Leverage built-in tools such as the Opening Range Breakout, Point of Control (POC) and precision session lines so you never miss a breakout or rejection.
🎯 Key Features
- Session Visualization & Management – fully customizable times, colors and labels, even for overlapping markets
- Advanced Drawing Tools – includes Double ❘❘ and Middle line drawers, breakout rectangles, text markers and a Double Line Mode for minimalistic traders
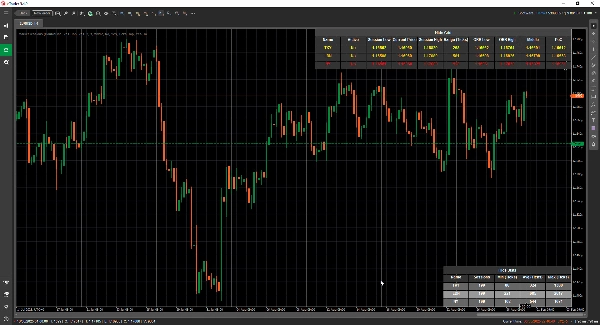
- Statistics Panel – view Total Sessions, Min, Avg and Max ranges for each session (in Ticks, Pips or %)
- Grid Mode - allows you to view the current active sessions in a table, so you can see the sessions in a higher timeframe.
- Flexible Configuration – customize text placement, range modes, drawing preferences and themes
- Alerts & Integrations – Telegram/Discord integration with sound and visual alerts
📦 What You Get
- MarketSessions.algo (ready to use)
- Lifetime Updates (no recurring fees)
- Friendly Support (direct access if you need help)
💻 Requirements
- cTrader platform
- .NET 6.0 runtime
✅ Install in minutes
✅ Trade with absolute confidence
📘 Parameter Reference (Friendly Version)
List of Sessions Available
- New York
- London
- Frankfurt
- Tokyo
- Hong Kong
- Shanghai
- Singapore
- Wellington
- Sydney
- Toronto
General Settings
- Drawing Mode – Choose how session lines are drawn on the chart (Rectangle / Double Line / Middle Line)
- Show Session Name – Display the name of each session directly on your chart
- Session Name Location – Decide where the session name text appears (top, center, bottom)
- Text Bold – Makes the session name bold so it’s easier to read
- Top Text Offset – Adds extra spacing from the top (so text doesn’t overlap candles)
- Bottom Text Offset – Adds extra spacing from the bottom of the session area
- Text Time Location – Show the session time along with the session name
- Use Short Session Name – Switches to shorter names (e.g. NY instead of New York)
- Show Session Range – Highlight the full price range covered by the session
- Session Range Mode – Choose how the price range is calculated (high/low or open/close)
- Session Range Location – Place the range marker either at the top or bottom of the range
- Show High – Display the session’s highest price
- Show High Location – Choose where the High label appears
- Show Low – Display the session’s lowest price
- Show Low Location – Choose where the Low label appears
- Extend High/Low Lines (Minutes) - Allows extending these lines for x minutes forward
- Show Opening Range Breakout – Draw a breakout box at the session open
- Extend ORB Lines (Minutes) - Allows extending these lines for x minutes forward
- Show Middle Lines – Add midlines to help identify fair value
- Extend Middle Lines (Minutes) - Allows extending this line for x minutes forward
- Show PoC – Display the Point of Control (most traded price of the session)
- Extend Middle Lines (Minutes) - Allows extending this line for x minutes forward
- Filled Transparency – Control how transparent the background fill of the session is
Statistics
- Draw Statistics – Show/hide the statistics panel on your chart
- Stats Horizontal Alignment – Align the panel (Left / Center / Right)
- Stats Vertical Alignment – Choose whether the panel appears on top or bottom
- Title Color – Text color for the “Statistics” title
- Even Row Color – Background color for even-numbered rows in the panel
- Odd Row Color – Background color for odd-numbered rows in the panel
- Foreground Color – Text color used inside the panel
Telegram
- Use – Enable or disable Telegram alerts
- Token – Your Telegram Bot token
- ChatId – The chat ID where alerts will be sent
Discord
- Use – Enable or disable Discord alerts
- WebhookUrl – Discord webhook URL for sending session alerts
Sound Alerts
- New Session Sound Alert – Play a sound when a new session begins
- Session Completed Sound Alert – Play a sound when a session ends
Grid
- Force Grid - Forces rendering the grid irrespective of the TimeFrame used
- Grid Visible for Above TimeFrame - Let's you select at which Timeframe and beyond this Grid is visible
- Message Box Notification - Notifies why the normal rendering mode is not possible and switches to the Grid Mode
- Grid Horizontal Alignment
- Grid Vertical Alignment
Session Example (New York)
⚠️ Same parameters apply to each session (London, Tokyo, Sydney, etc.)
- Active – Enable or disable this specific session
- Color – Session color used on the chart
- Fill Region – Fill the background of the session area
- Line Style – Choose line style (solid, dashed, etc.)
- Line Thickness – Control the thickness of the session borders
Make the market’s clock your ally
Get MarketSessions today and never miss a profitable session again.


