!["[Stellar Strategies] MARSI Signal Plotter" logo](https://market-prod-23f4d22-e289.s3.amazonaws.com/ce01bd9f-8907-48d9-a68d-7c0bde6b9704_4aDZjo80P5.png)
!["[Stellar Strategies] MARSI Signal Plotter" uploaded image](https://market-prod-23f4d22-e289.s3.amazonaws.com/deaf177f-507a-487c-8f5b-074841f04ae5_6tFtrrcz5u.png)
!["[Stellar Strategies] MARSI Signal Plotter" uploaded image](https://market-prod-23f4d22-e289.s3.amazonaws.com/29d09329-46d6-4531-a594-2dd4ea36c652_3iHegkImgC.png)
!["[Stellar Strategies] MARSI Signal Plotter" uploaded image](https://market-prod-23f4d22-e289.s3.amazonaws.com/3ee71424-00bc-4dcc-b47a-3355352ebc63_aSHGLN6i6K.png)
!["[Stellar Strategies] MARSI Signal Plotter" uploaded image](https://market-prod-23f4d22-e289.s3.amazonaws.com/bd253ec0-baa9-42eb-a9bd-35f43a752a37_Cg1QXSXE8M.png)
!["[Stellar Strategies] MARSI Signal Plotter" uploaded image](https://market-prod-23f4d22-e289.s3.amazonaws.com/59e45ebc-d288-4db7-b97e-6f5afa89bec0_4aDZjo80P5.png)
MARSI Signal Plotter
General Description: The MARSI Signal Plotter is a versatile indicator designed to work seamlessly with various chart types, including Renko, Heikin Ashi, and especially Range Bars. This indicator utilizes a combination of Moving Averages (MA) and the Relative Strength Index (RSI) to identify significant bullish and bearish trends in the market. By filtering out market noise, it provides clear and actionable trading signals through plotted arrows, helping traders make informed decisions.
Features:
- Works with Multiple Chart Types: Compatible with Renko, Heikin Ashi, Range Bars, and other chart types.
- Bullish and Bearish Signals: Visual arrows indicating potential buy and sell opportunities.
- Customizable Parameters: Adjustable periods for Moving Averages and RSI to fit different trading styles.
- Trend Identification: Utilizes moving average crossovers and RSI levels to identify trends and potential reversal points.
How to Use:
- Setup and Configuration:
- Select the “MARSI Signal Plotter” indicator from your charting software’s indicator list.
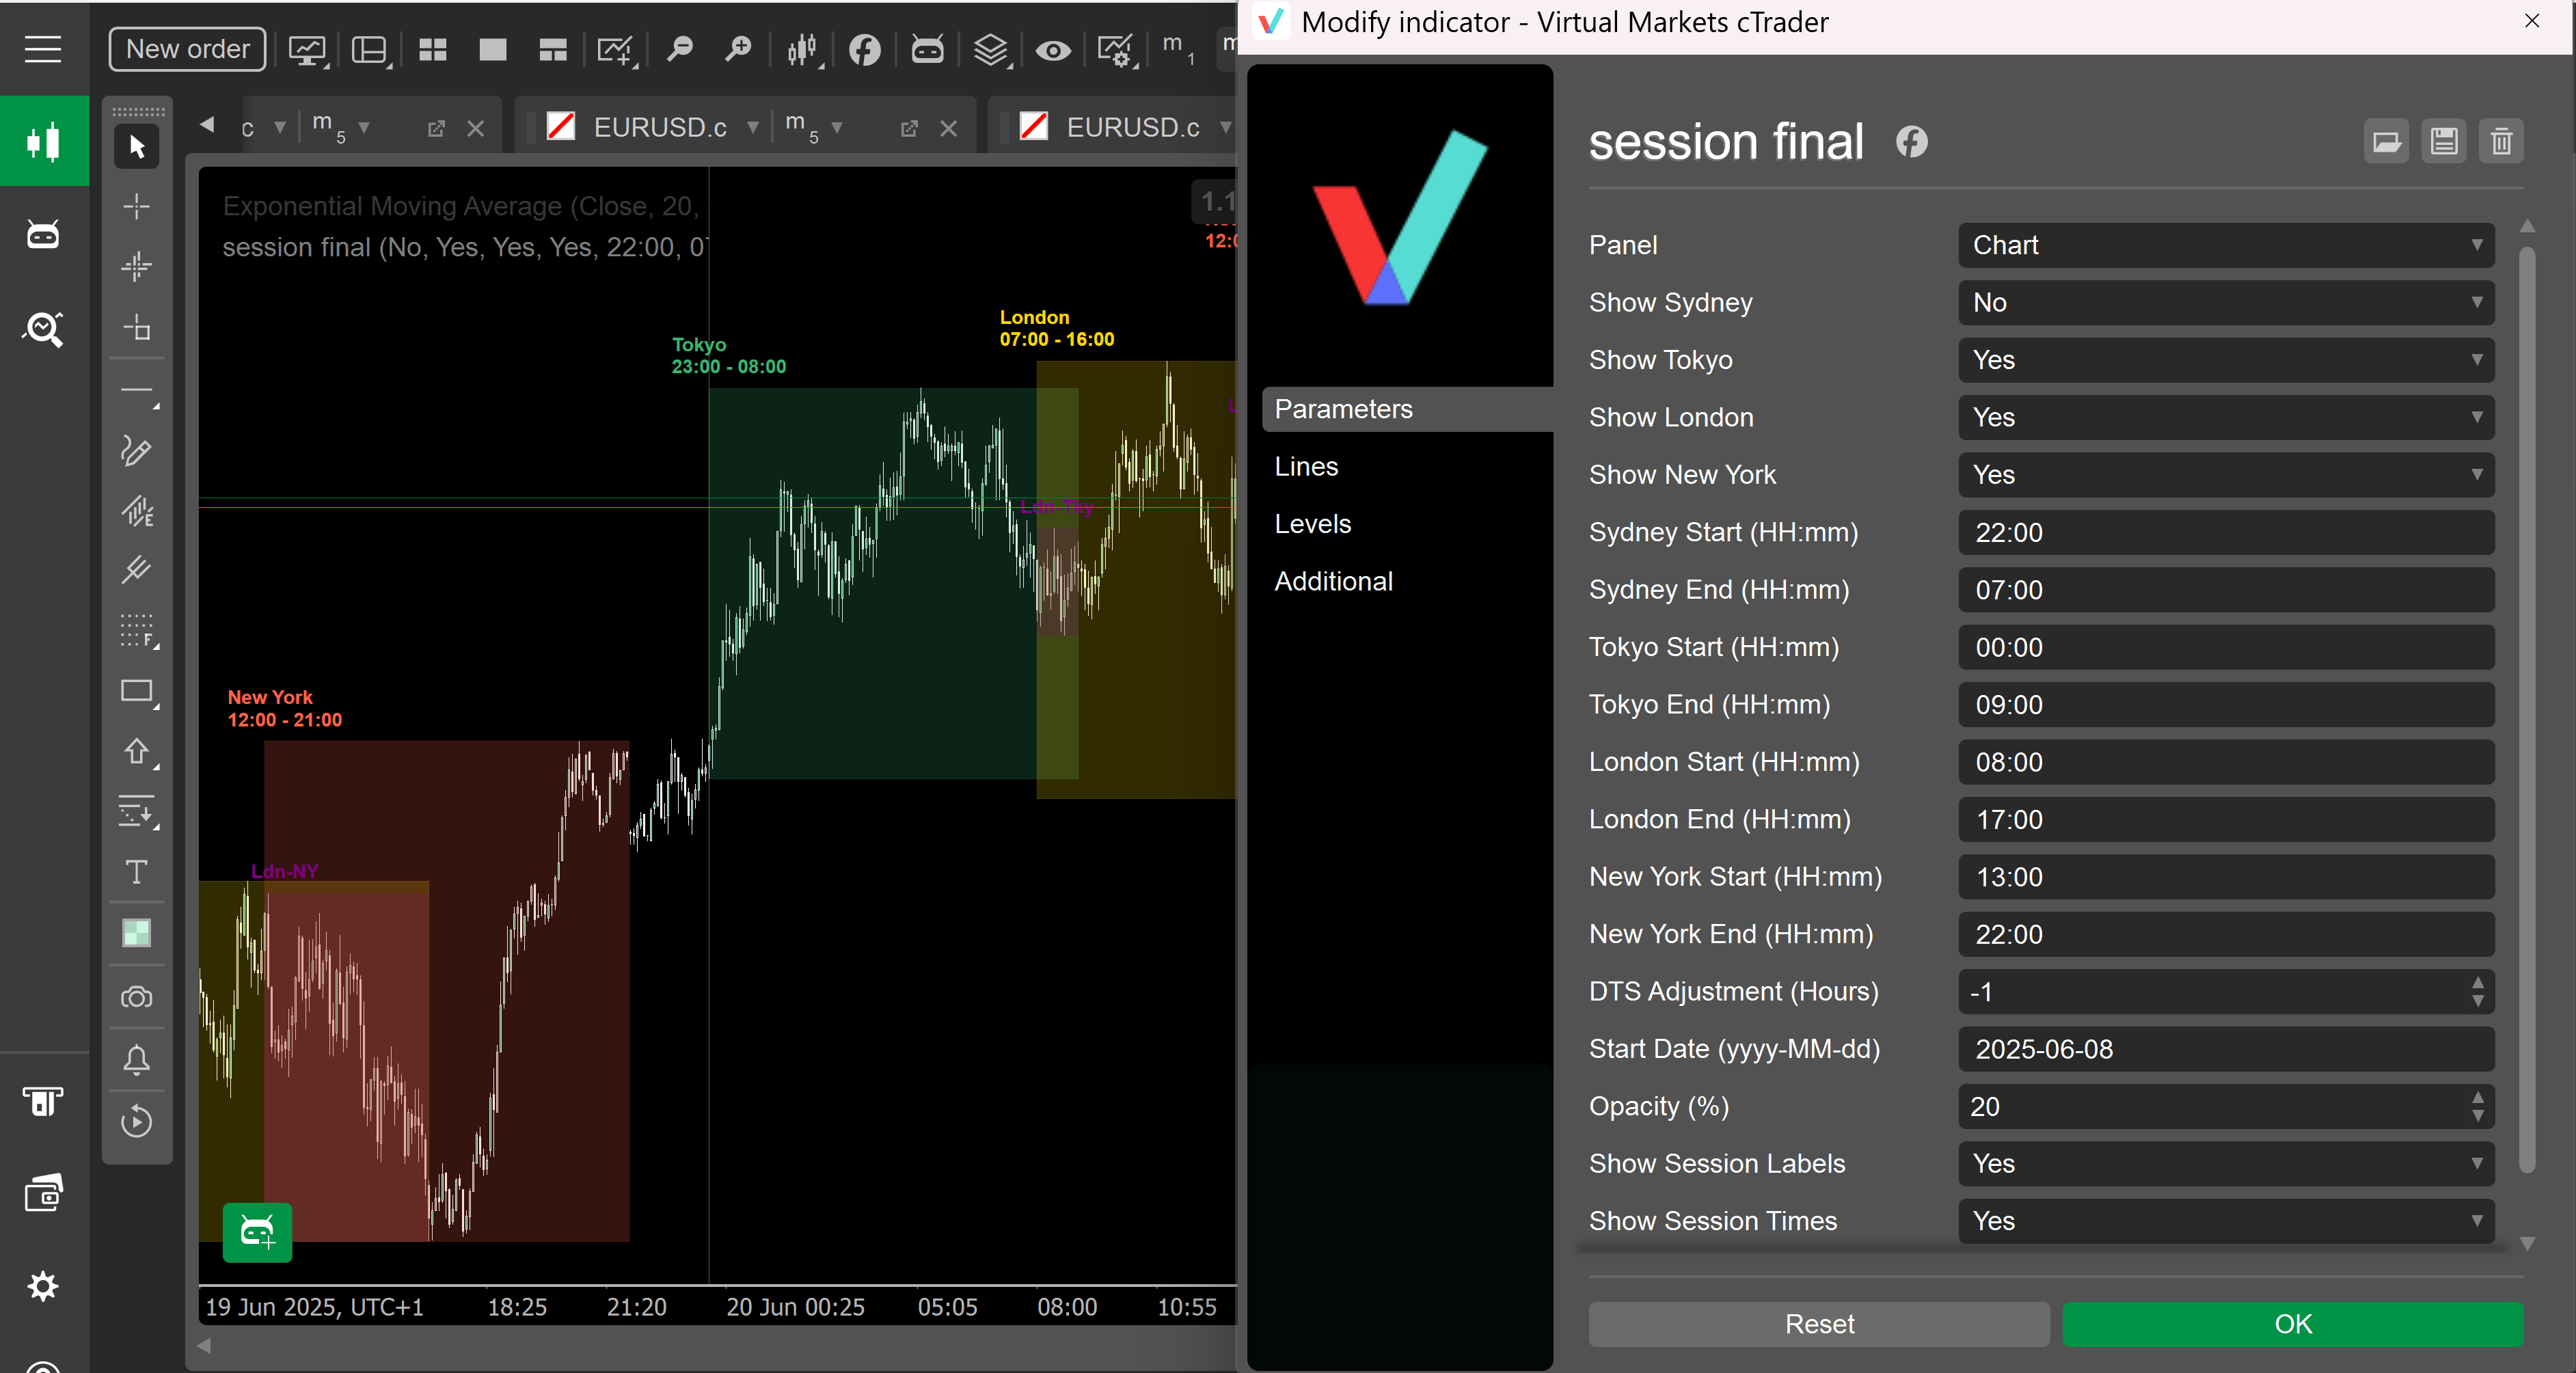
- Configure the parameters to suit your trading strategy:
- Fast Period: Number of periods for the fast moving average (default: 14).
- Slow Period: Number of periods for the slow moving average (default: 21).
- RSI Period: Number of periods for the RSI calculation (default: 14).
- Overbought Level: RSI level considered overbought (default: 70).
- Oversold Level: RSI level considered oversold (default: 30).
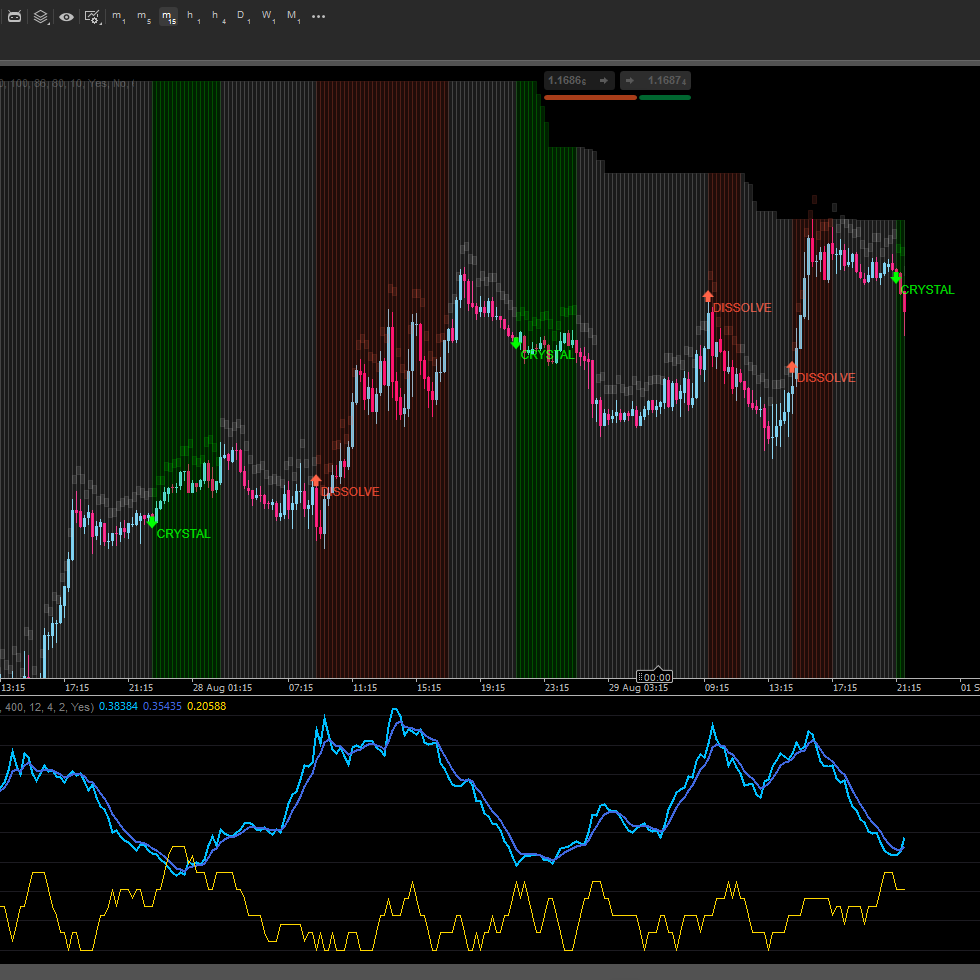
- Interpreting Signals:
- Buy Signal: An upward arrow (↑) appears below a Range Bar/Renko/Heikin Ashi bar when the fast moving average crosses above the slow moving average and the RSI is above the oversold level.
- Sell Signal: A downward arrow (↓) appears above a Range Bar/Renko/Heikin Ashi bar when the fast moving average crosses below the slow moving average and the RSI is below the overbought level.
- Using Moving Averages and RSI for Visualization:
- To better visualize the signals, apply standard Moving Averages and RSI indicators with the same settings as the MARSI Signal Plotter. This will allow you to see the crossover points and RSI levels more clearly on the chart, enhancing your understanding of the signals.
- Recommended Chart Type:
- For the most accurate results, it is recommended to use Range Bars. They help filter out market noise, providing clearer signals and improving accuracy.
- Trading Strategy:
- Enter a Trade: Enter a long trade when a buy signal appears. Enter a short trade when a sell signal appears.
- Exit a Trade: Exit the trade based on your risk management strategy or when an opposite signal appears.
- Optimization:
- Adjust the indicator parameters through backtesting and forward testing to optimize performance according to your specific trading plan and market conditions.
This indicator can be an excellent addition to your trading toolkit, providing clear signals and helping you navigate the complexities of the market with greater confidence. Enjoy trading with the MARSI Signal Plotter!
.....................................................................................................................................................................................................................
Trader Warning: Trading involves significant risk and is not suitable for every investor. You may lose some or all of your invested capital. Always ensure you fully understand the risks and seek independent financial advice if necessary. The MARSI Signal Plotter is a tool to assist in making informed decisions but does not guarantee profitable trades.
!["[Stellar Strategies] BOS Trend 1.0" logo](https://market-prod-23f4d22-e289.s3.amazonaws.com/808c7722-ba53-4633-b8a4-16f31eeb1fc2_[Stellar Strategies] BOS Trend.jpg)
!["[Stellar Strategies] Market Session Ultimate" logo](https://market-prod-23f4d22-e289.s3.amazonaws.com/92b85b76-697c-4a8f-811f-ddd63eb8f9c8_cTrader_oSHtUgCtNJ.png)
!["[Stellar Strategies] Market Structure Breakout" logo](https://market-prod-23f4d22-e289.s3.amazonaws.com/99d762b3-fbbe-489d-9c19-e72c41ffe387_cT_cs_4141285_EURUSD_2025-04-21_20-25-12.png)
!["[Stellar Strategies] Inside Bar with Signals" logo](https://market-prod-23f4d22-e289.s3.amazonaws.com/c12d088e-7b52-4961-a0d2-7e38a2499bd3_cT_cs_4141285_EURUSD_2025-07-15_13-15-32.png)
!["[Stellar Strategies] Wave Trend Pro" logo](https://market-prod-23f4d22-e289.s3.amazonaws.com/8c93438a-6b0a-4026-93b2-0694329a3bc1_cT_cs_4141285_EURUSD_2025-04-25_17-52-31.png)
!["[StellarStrategies] Scheduled Trade Executor" logo](https://market-prod-23f4d22-e289.s3.amazonaws.com/f13e96a0-274f-490e-8aa5-5a154d8bcf60_stellar12.jpg)
!["[Stellar Strategies] Linear Regression Candles 1.1" logo](https://market-prod-23f4d22-e289.s3.amazonaws.com/19ef277f-e0b6-48ef-8941-88bfbba145f3_cT_cs_4141285_EURUSD_2025-03-30_19-53-31.png)
!["[Stellar Strategies] Visual Trend Momentum" logo](https://market-prod-23f4d22-e289.s3.amazonaws.com/3835d044-1c21-4909-9d3c-2635f984b93d_visualtrendmomentum.jpg)
!["[Stellar Strategies] QQE" logo](https://market-prod-23f4d22-e289.s3.amazonaws.com/ed4b3af5-54e4-404e-80eb-a23fa7ef0282_cTrader_7oDDAbSmSP.png)
!["[Stellar Strategies] Moving Averages Combined 1.0" logo](https://market-prod-23f4d22-e289.s3.amazonaws.com/b4cd360c-5f3c-4902-b2e1-6b86da1199bb_Gemini_Generated_Image_nl1erpnl1erpnl1e.jpg)
!["[Stellar Strategies] SP500 Gap Closure cBot 1.0" logo](https://market-prod-23f4d22-e289.s3.amazonaws.com/62a77232-02a9-423b-a5e4-bd2c2bc8db97_cT_cs_4141285_US500_2025-03-21_17-12-57.png)
!["[Stellar Strategies] Ultimate Trend & Momentum Dashboard" logo](https://market-prod-23f4d22-e289.s3.amazonaws.com/d8a894f3-34df-4f37-b4a3-c37e971e4e1f_cT_cs_4141285_NAS100_2025-06-24_17-12-20.png)
!["[Stellar Strategies] Market Regime Filter" logo](https://market-prod-23f4d22-e289.s3.amazonaws.com/cb84a98c-46f6-4cfd-b0ba-16518a618cb1_cT_cs_4141285_EURUSD_2025-04-20_16-50-30.png)

.jpg)

.jpeg)