Indicator
NAS100
NZDUSD
XAUUSD
Commodities
Forex
Signal
EURUSD
GBPUSD
BTCUSD
Indices
Prop
Stocks
Crypto
USDJPY
Scalping
Footprint Chart_noSourceCode
22/09/2025
Desktop
Since 15/01/2025
Sales
1
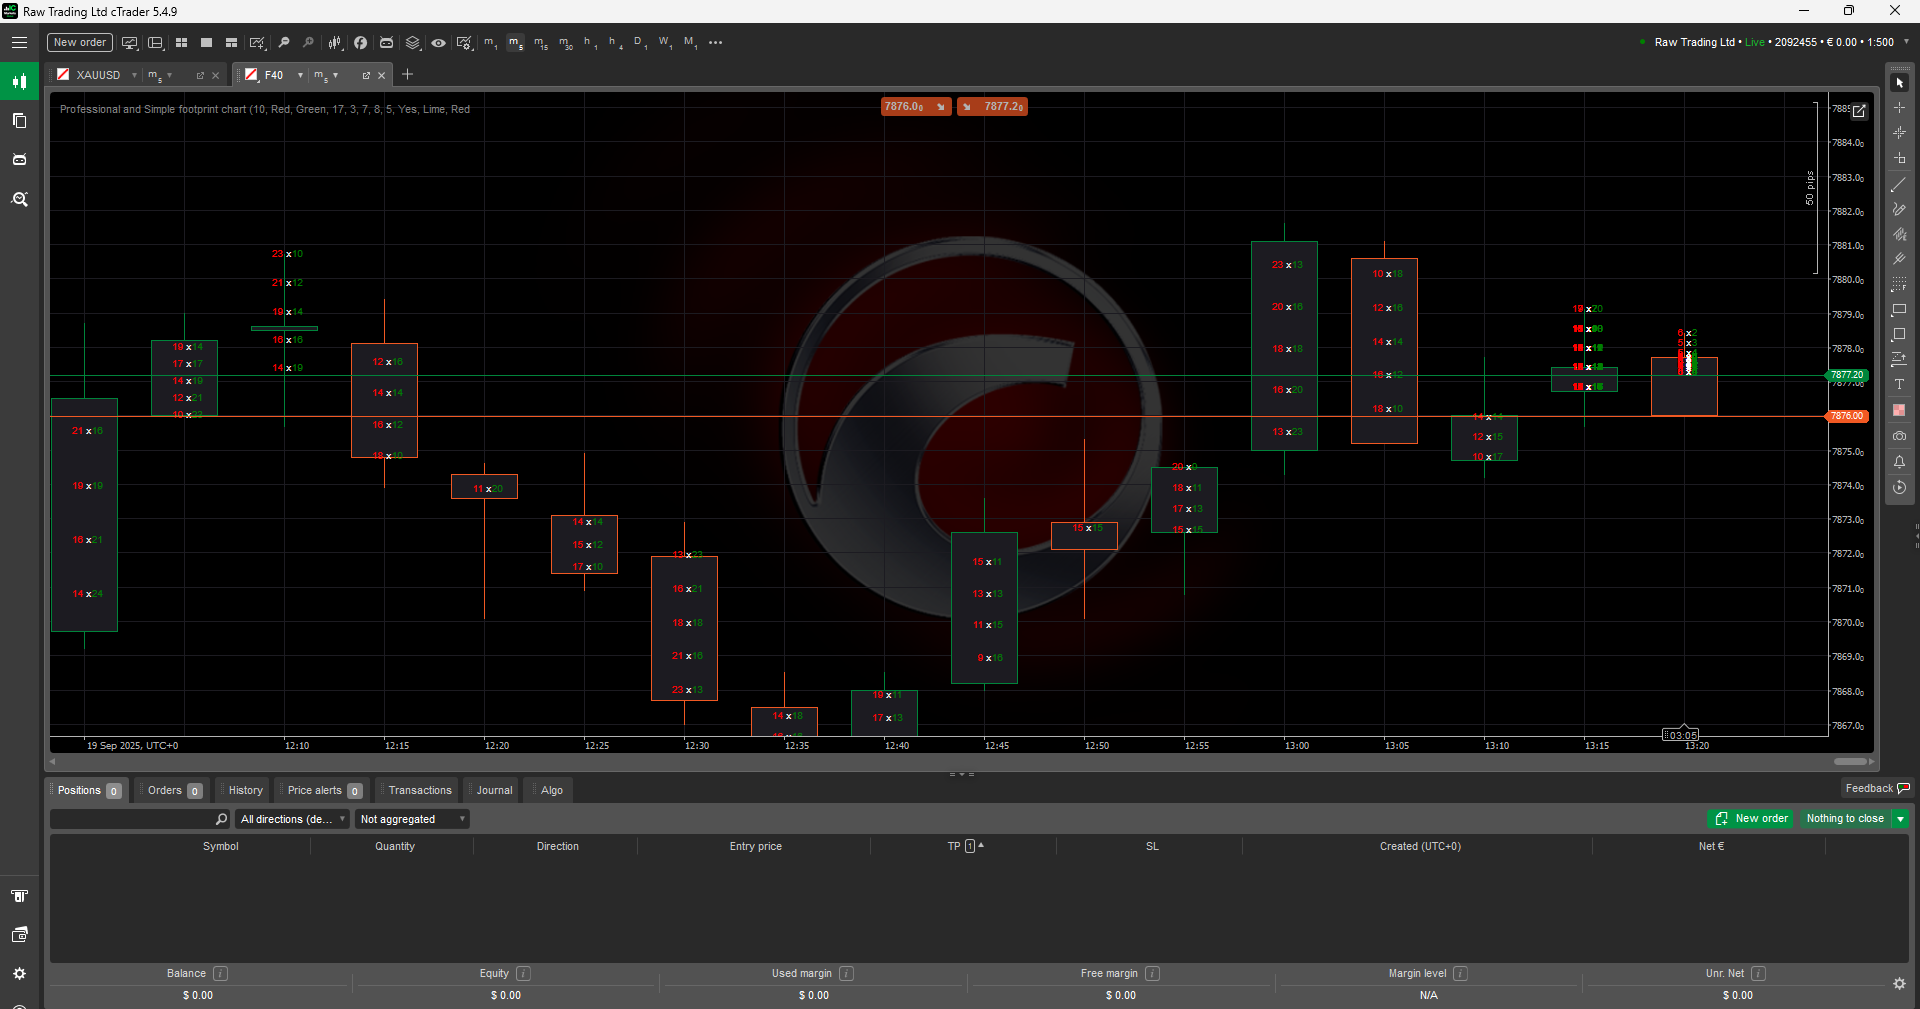
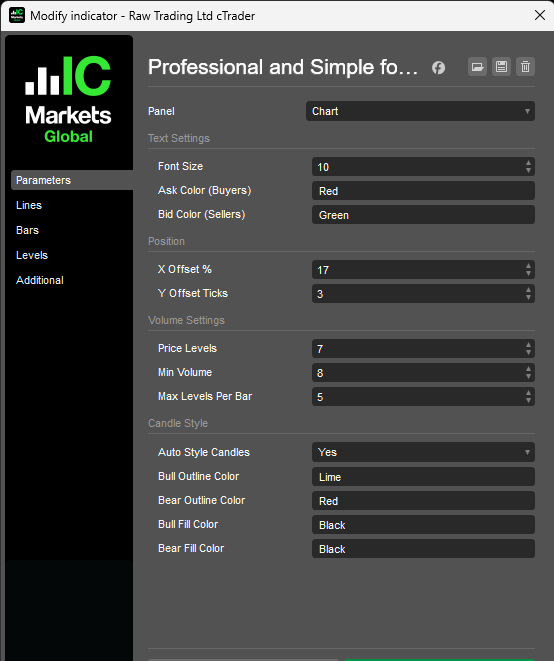
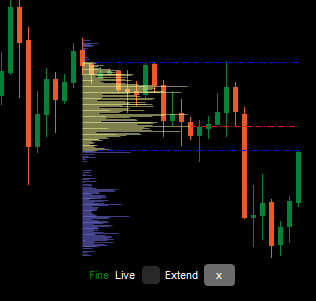
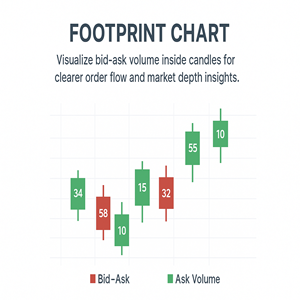
ootprint Chart Indicator
The Footprint Chart Indicator provides traders with a detailed view of order flow by displaying bid and ask volume directly inside each price candle. Unlike traditional candlestick charts, this tool allows users to see where buying and selling pressure is concentrated at specific price levels. By highlighting imbalances between buyers and sellers, it offers deeper insights into market depth, liquidity, and trading activity. This makes it an essential tool for traders seeking to refine entries, exits, and risk management through advanced order flow analysis.


.jpg)

.png)
!["[Stellar Strategies] MARSI Signal Plotter" logo](https://market-prod-23f4d22-e289.s3.amazonaws.com/ce01bd9f-8907-48d9-a68d-7c0bde6b9704_4aDZjo80P5.png)