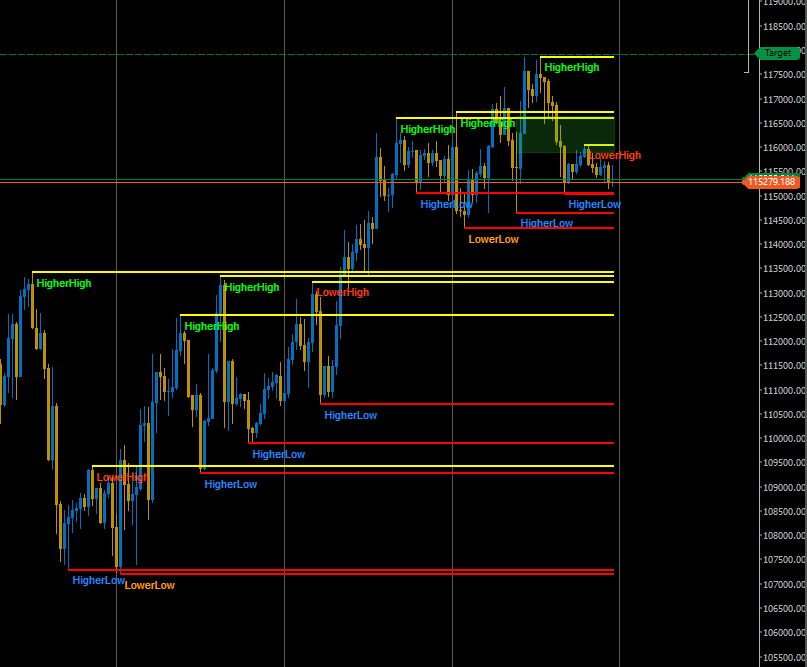

Market Swing Structure Pullback Pro automatically maps structure (Higher High/Low, Lower High/Low), draws clean support/resistance levels from a higher timeframe, and highlights actionable entries on pullbacks or BOS retests. A configurable Fibonacci retracement band helps you focus entries inside the “discount/premium” zone, and you can require a confirmation candle on a separate timeframe. Signals use Bid for longs and Ask for shorts.
Works on all symbols/timeframes supported by cTrader.
What it does
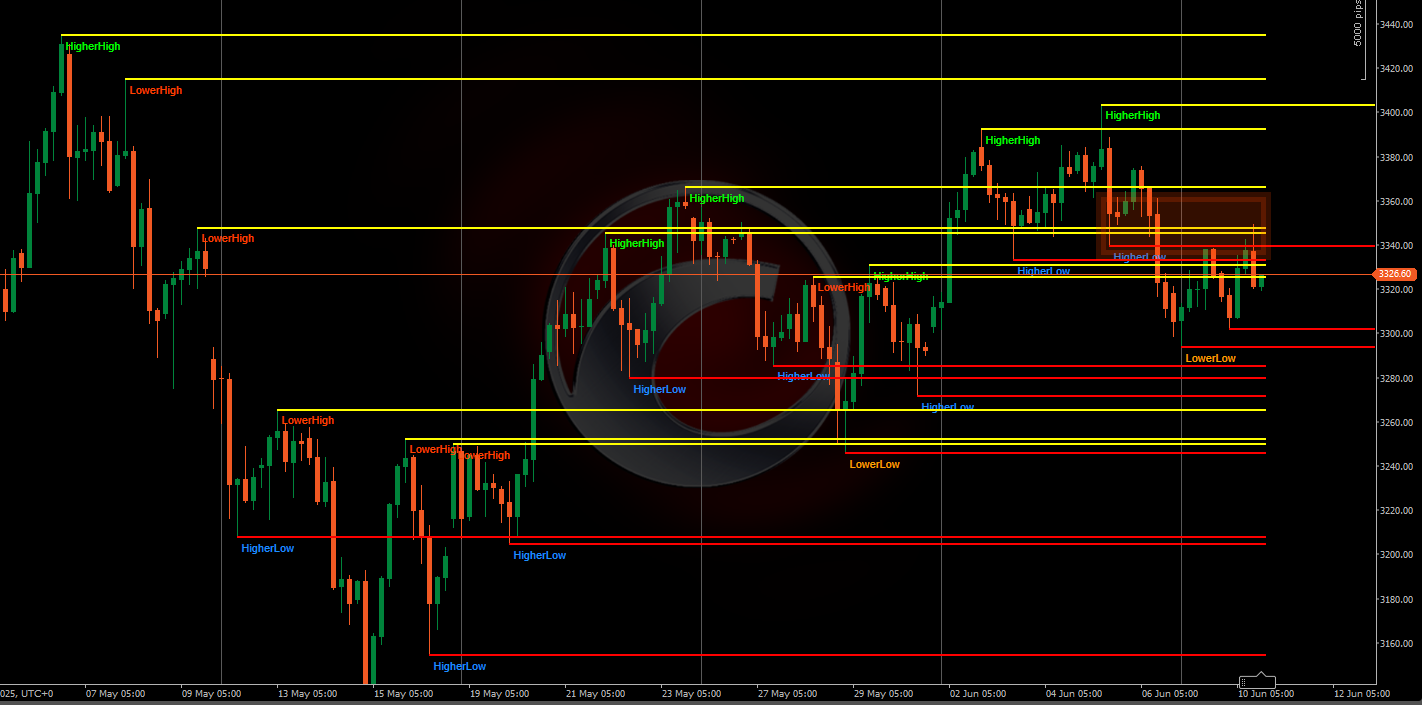
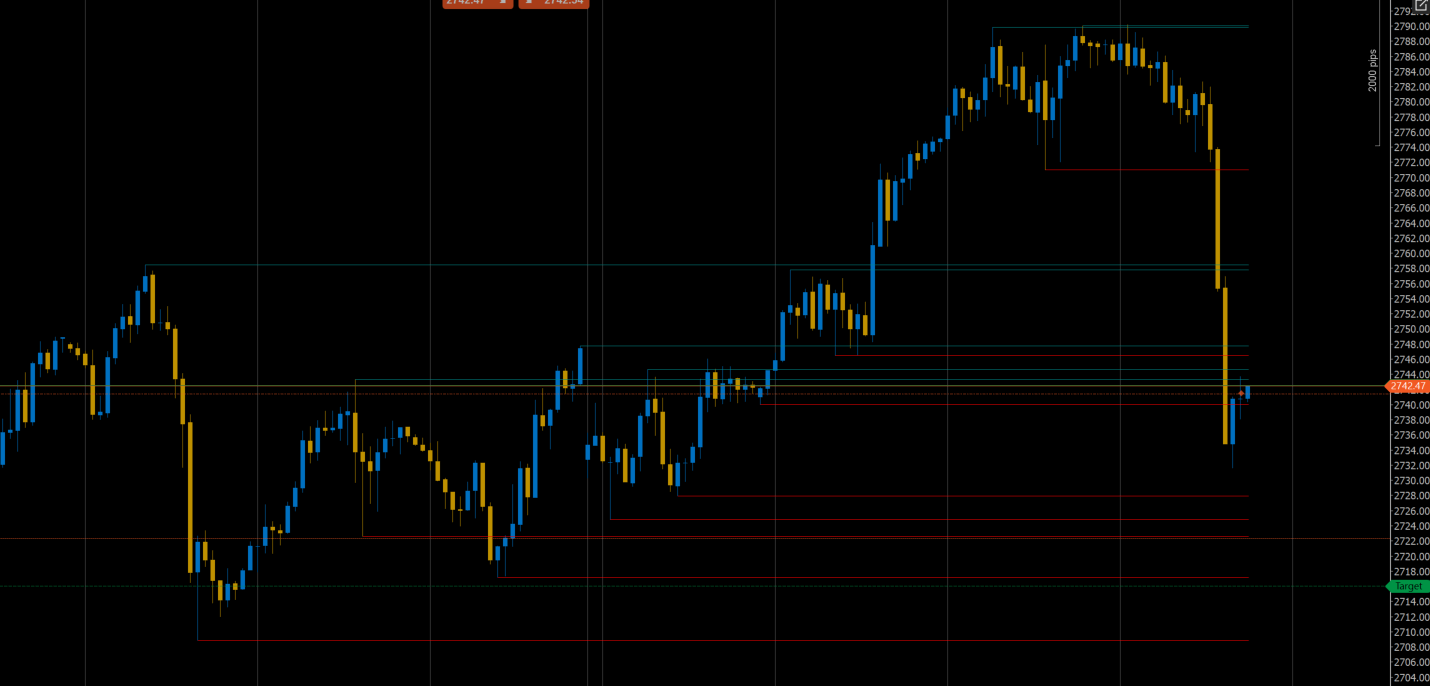
- Support/Resistance (MTF): Finds swing highs/lows on a chosen SR timeframe and plots deduped horizontal levels (flattening by pips).
- Market Structure: Labels HH/HL/LH/LL at detected swings with distance filtering to avoid noise.
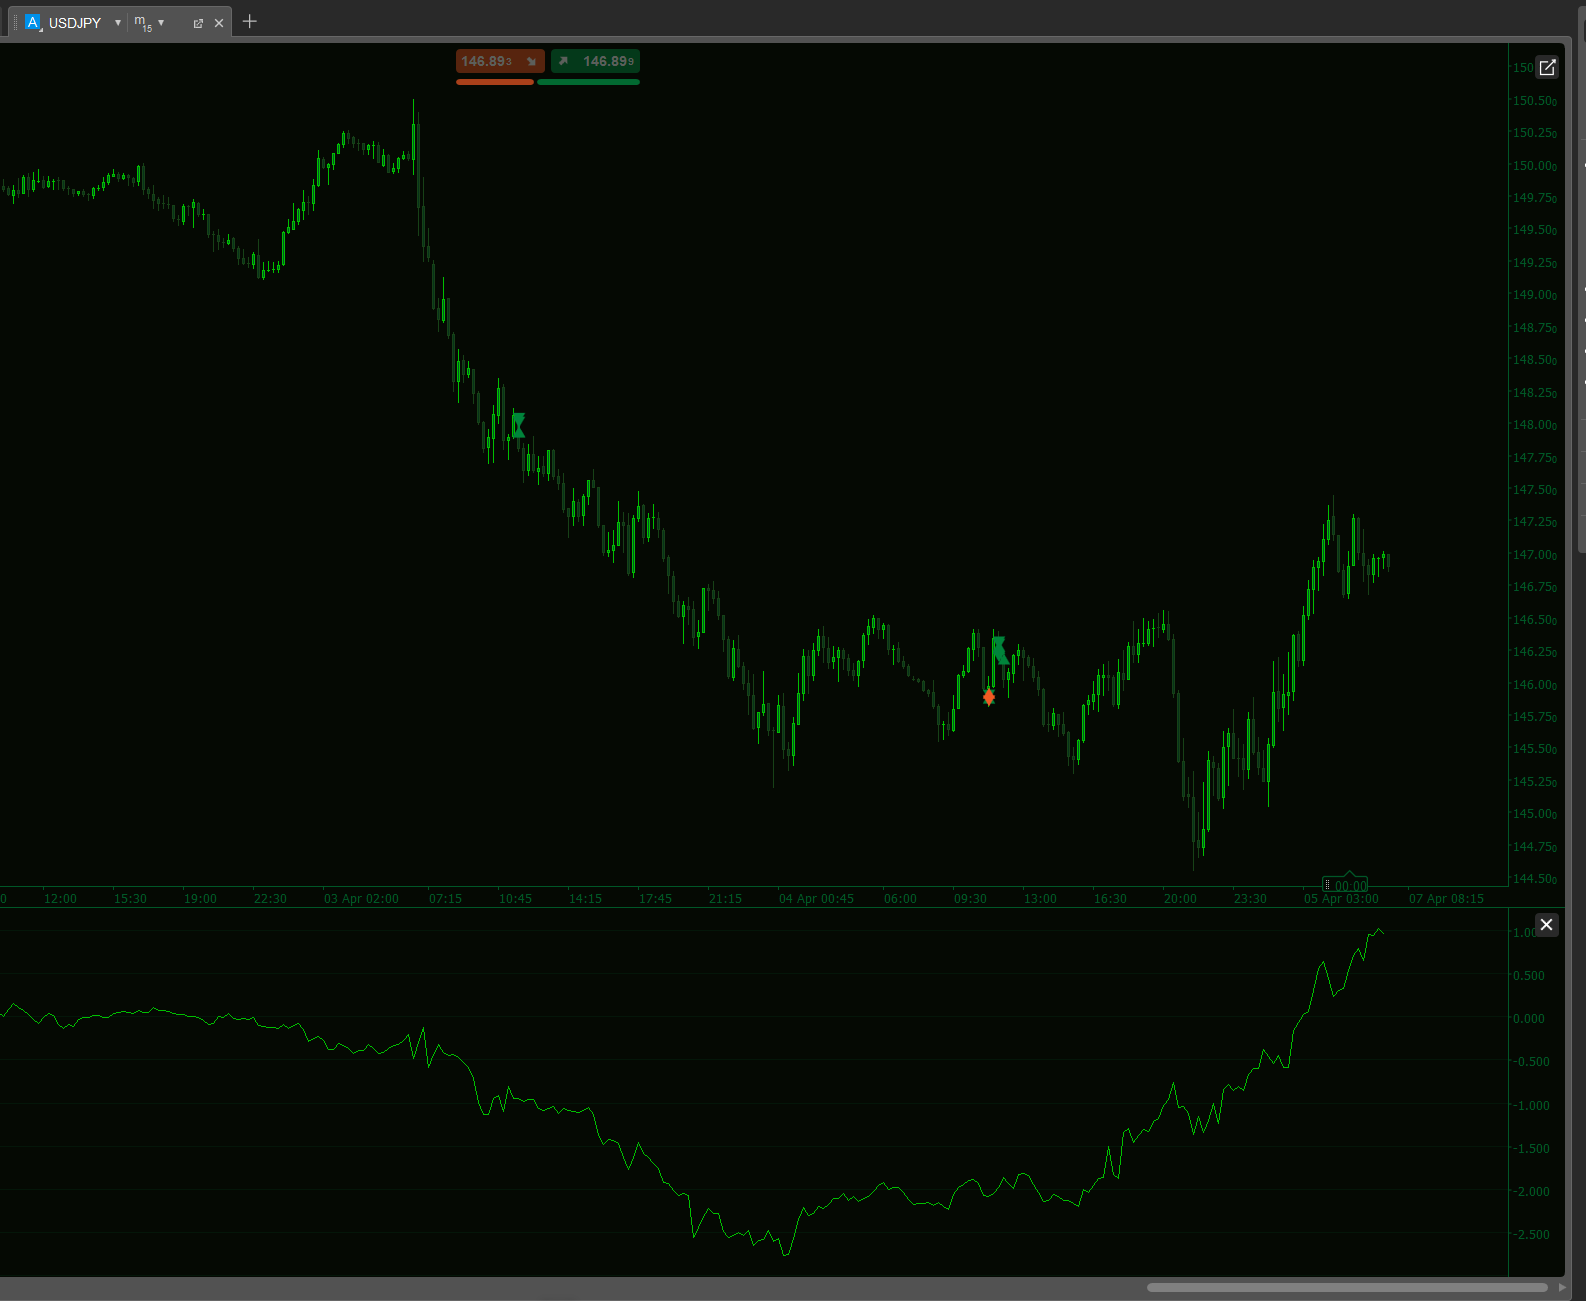
- Swing Pullback entries:
- Longs: HL → HH impulse; waits for price to pull back toward the last swing low (or a support level) and—optionally—into your fib band.
- Shorts: LH → LL impulse; mirror logic using the last swing high and resistance.
- Optional candle confirmation (Close in favor / Engulfing / Both) on a separate timeframe.
- BOS Pullback entries:
- Longs: break above the last Lower High → pullback near that BOS level or a support line, plus optional confirmation.
- Shorts: break below the last Higher Low → pullback near that BOS level or a resistance line, plus optional confirmation.
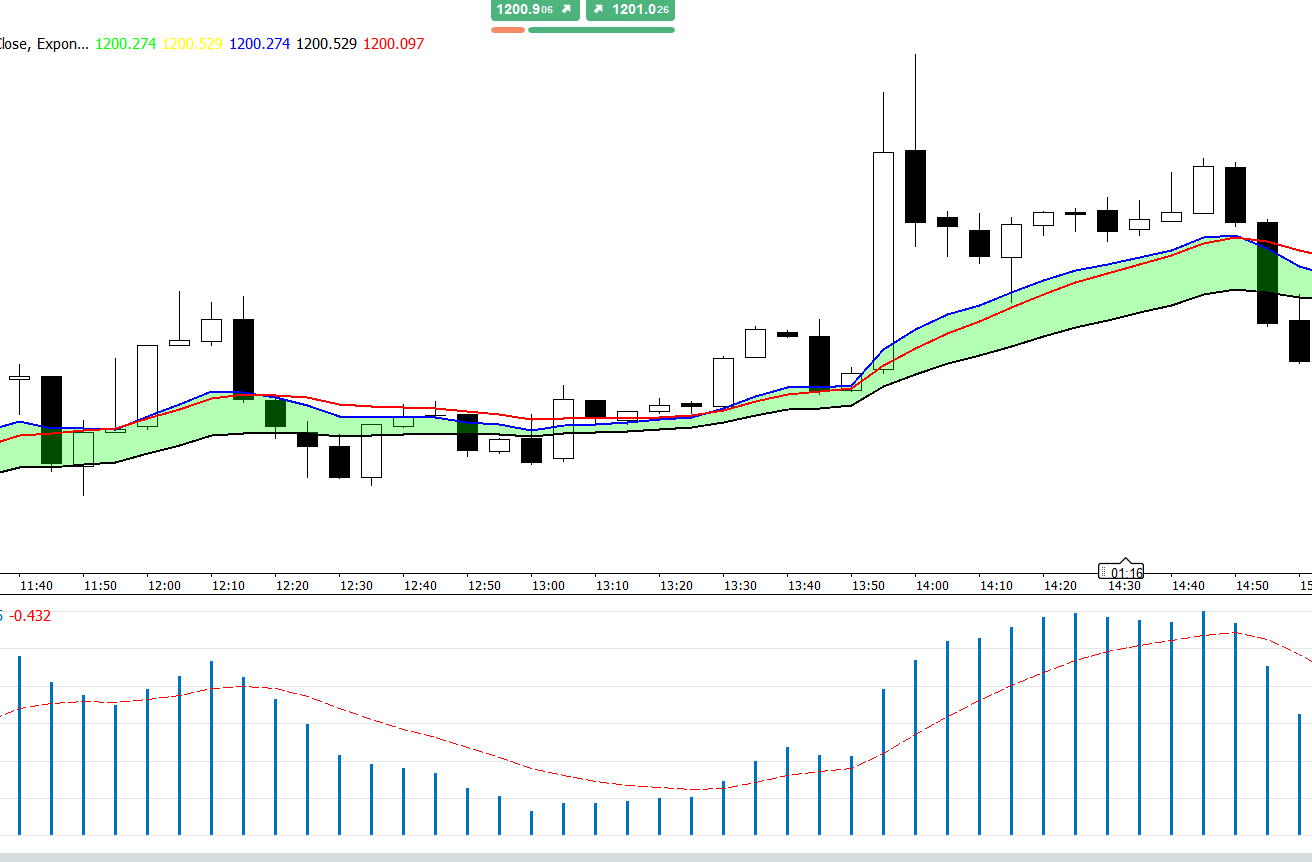
- Retracement Band (Fib): Shows a rectangle for the current impulse only (default) based on the actual pivot (last swing low for longs, last swing high for shorts). Colors, opacity, and border are configurable.
How signals are generated (quick logic)
- Swing Pullback (Long):
- Detect latest HL→HH leg.
- Compute fib band between HH and last swing low.
- Price is inside band (optional) and near HL or any support (pip tolerance).
- HL is recent (bar limit).
- Confirmation candle on the Confirmation Timeframe passes your mode.
→ Plot UpArrow at confirmation time/price (Bid or confirmation close).
- Swing Pullback (Short): mirror of the above.
- BOS Pullback (Long): broke the most recent Lower High, price pulls back near BOS level or a support, within recency, and passes confirmation → UpArrow.
- BOS Pullback (Short): mirror of the above.
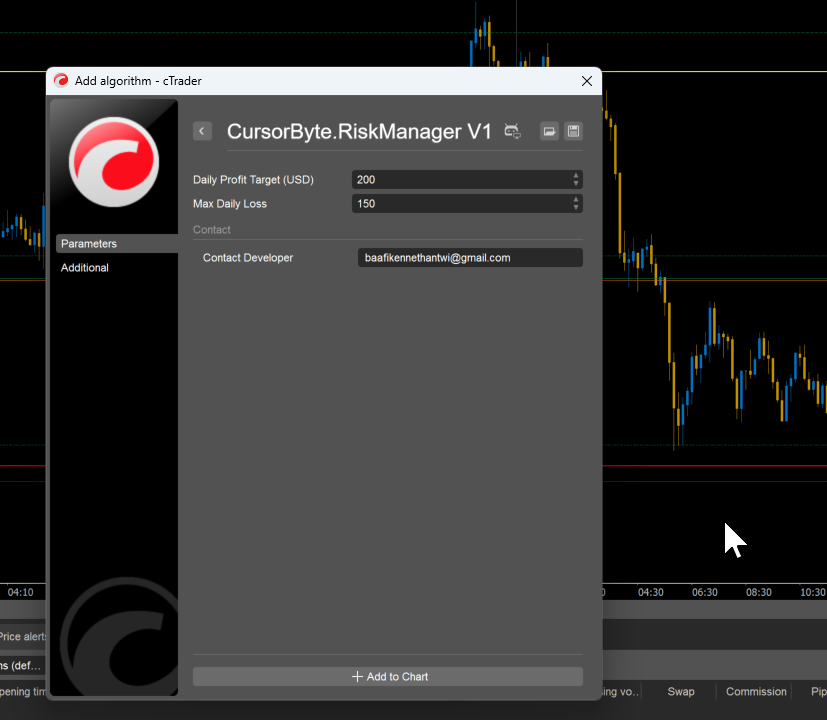
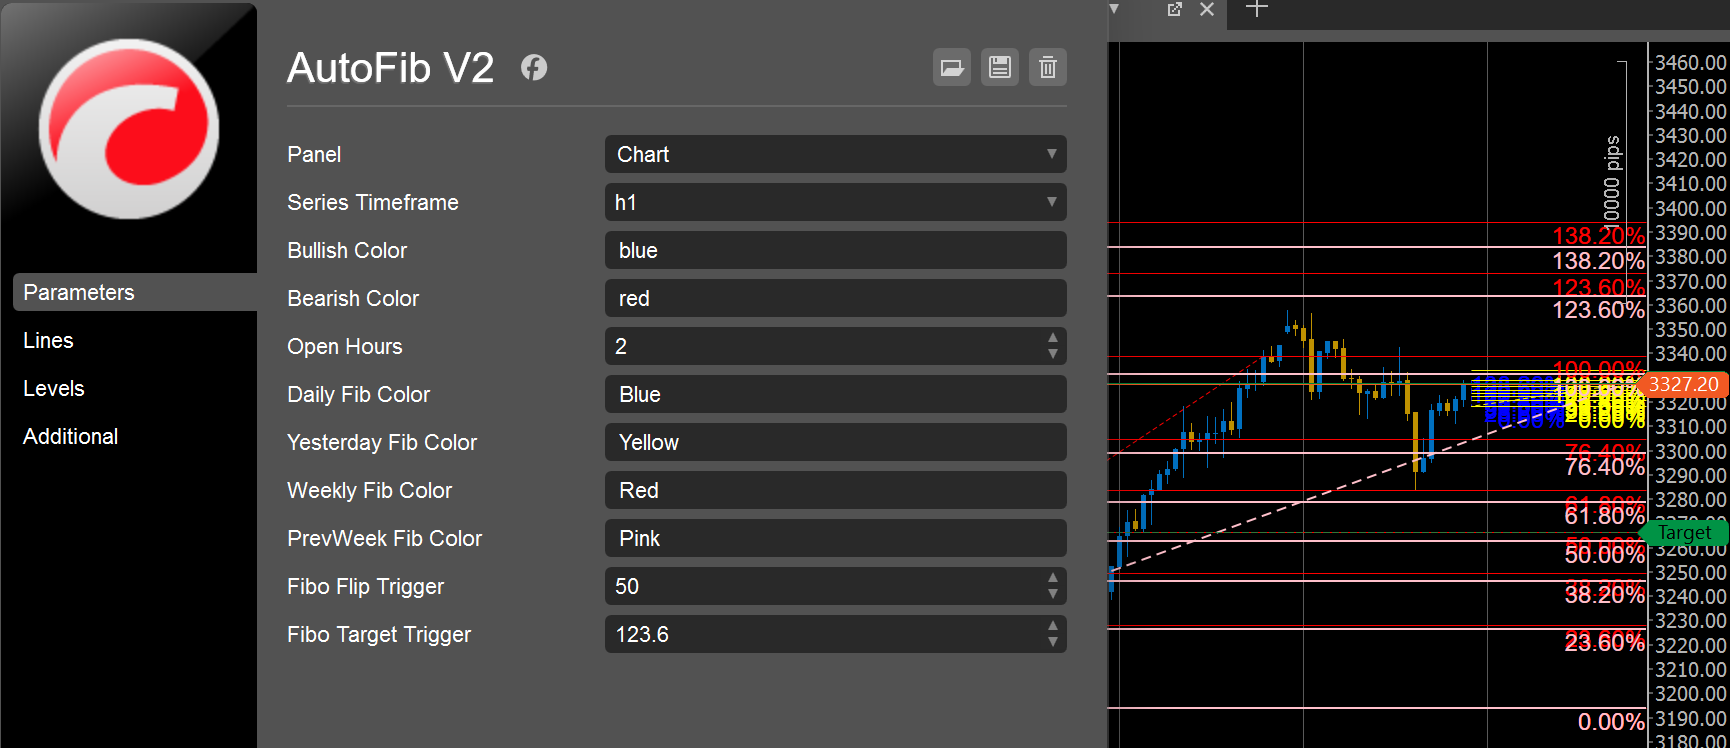
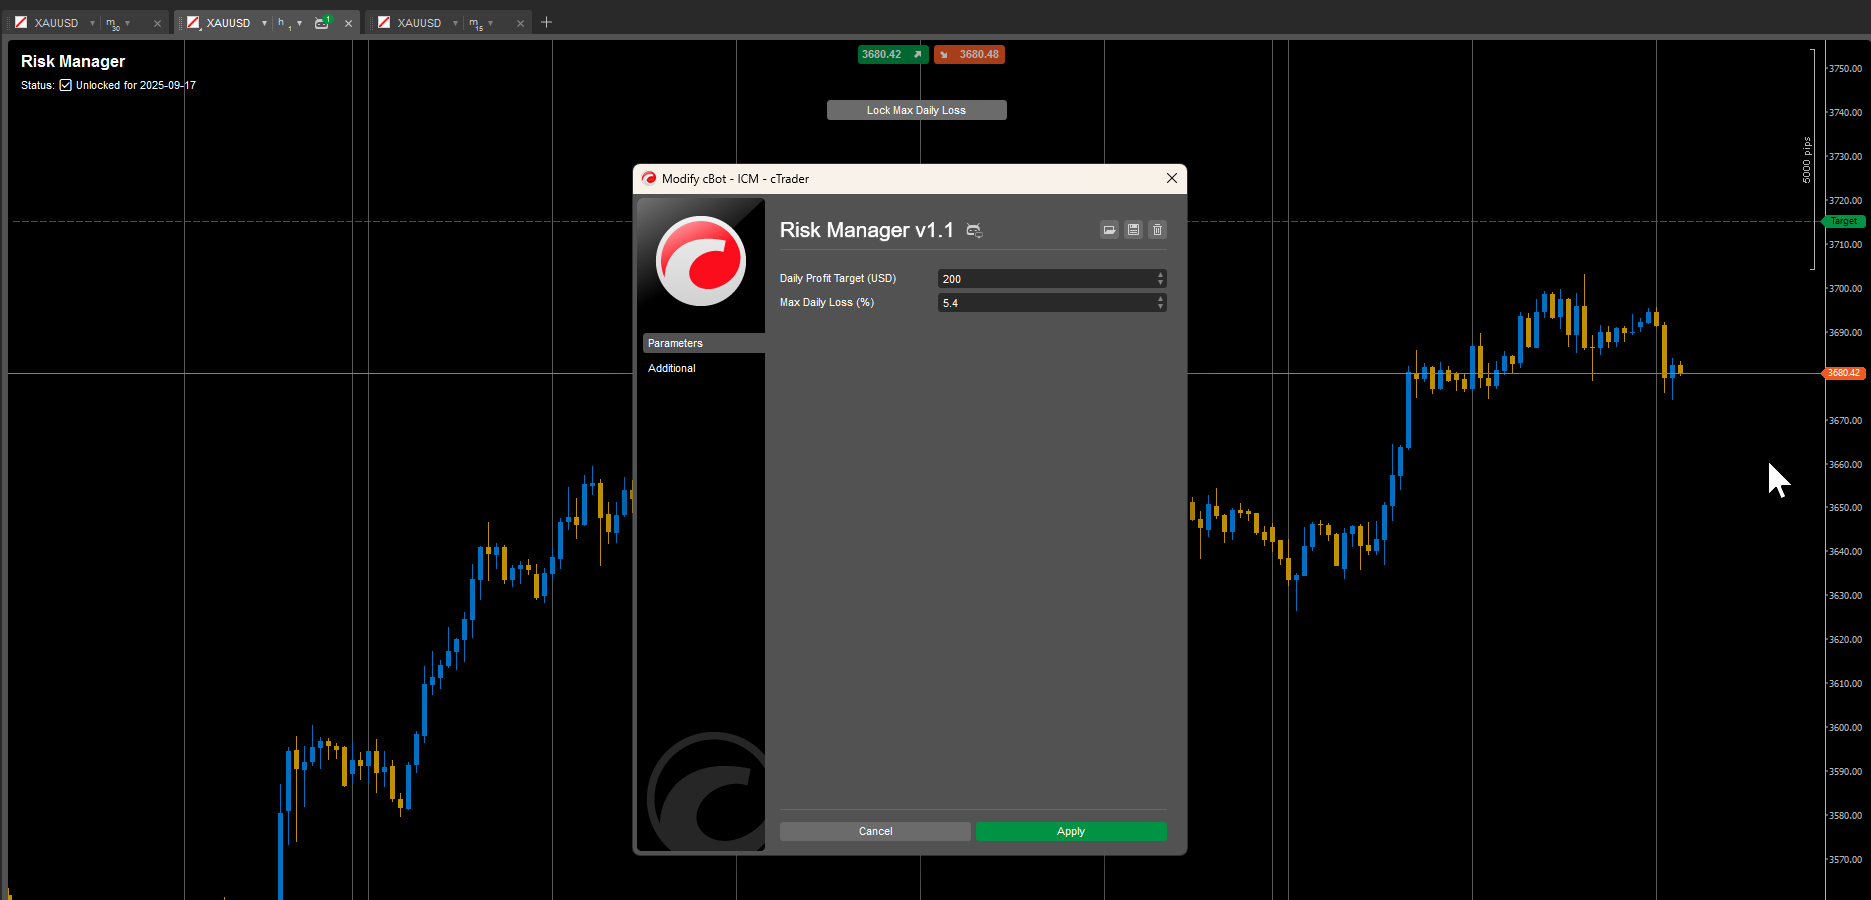
Parameters
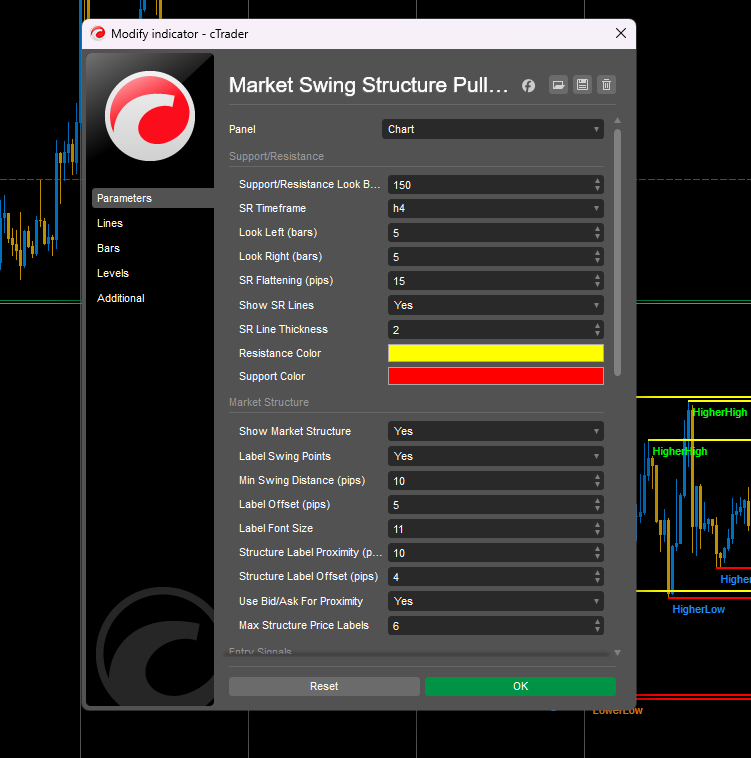
Support/Resistance
- Support/Resistance Look Back – How many bars to scan for SR on the SR timeframe.
- SR Timeframe – Timeframe used to build SR (e.g., H4).
- Look Left / Look Right (bars) – Swing detection window.
- SR Flattening (pips) – Merges nearby SR levels.
- Show SR Lines / SR Line Thickness – Visibility and style.
- Resistance Color / Support Color – Line colors.
Market Structure
- Show Market Structure – Draw HH/HL/LH/LL labels.
- Label Swing Points – Show the text labels at swings.
- Min Swing Distance (pips) – Minimum distance between consecutive swings to filter noise.
- Label Offset (pips) / Label Font Size – Placement and size for labels.
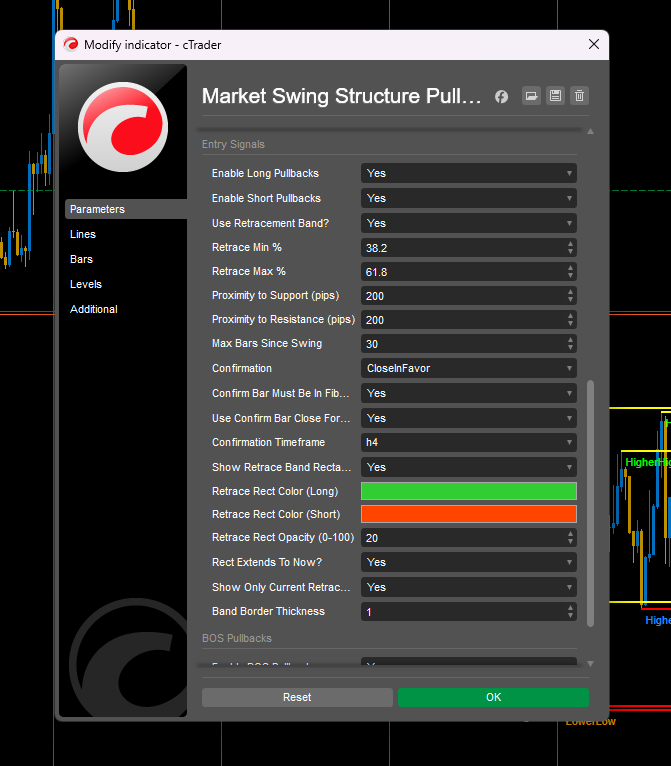
Entry Signals – Swing Pullbacks
- Enable Long Pullbacks / Enable Short Pullbacks – Turn long/short setups on/off.
- Use Retracement Band? – Require price to be within the fib band for entry logic.
- Retrace Min % / Retrace Max % – The band; order is flexible (auto-sorted).
- Proximity to Support/Resistance (pips) – Distance threshold to HL/support (long) or LH/resistance (short).
- Max Bars Since Swing – Recency limit for the impulse.
Confirmation (shared by Swing & BOS)
- Confirmation –
None,CloseInFavor(candle closes in trend direction),Engulfing, orCloseAndEngulfing. - Confirm Bar Must Be In Fib Band? – Only for Swing pullbacks (BOS ignores band).
- Use Confirm Bar Close For Signal? – Place the icon at the confirm bar close time/price.
- Confirmation Timeframe – TF for confirmation candles (independent from chart & SR TF).
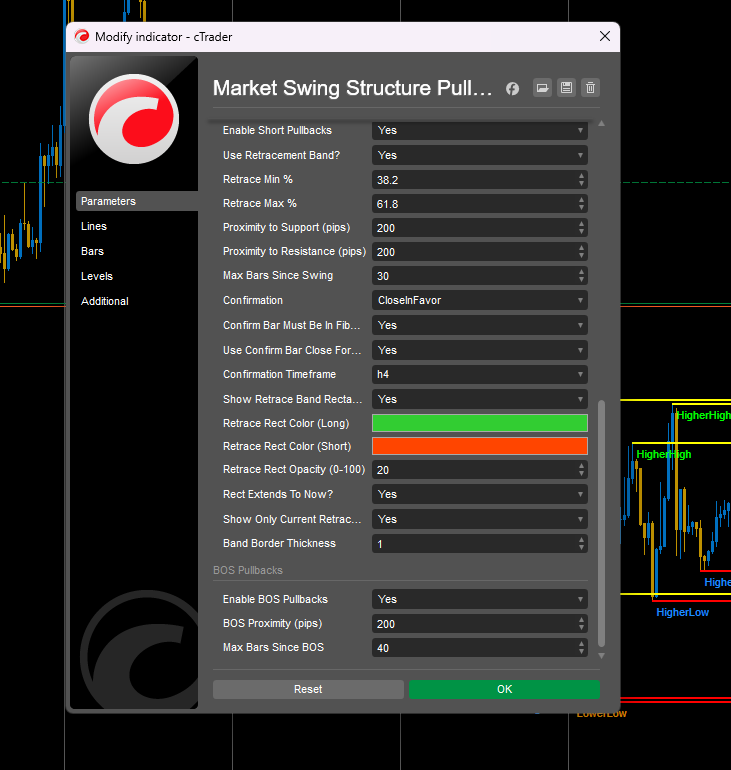
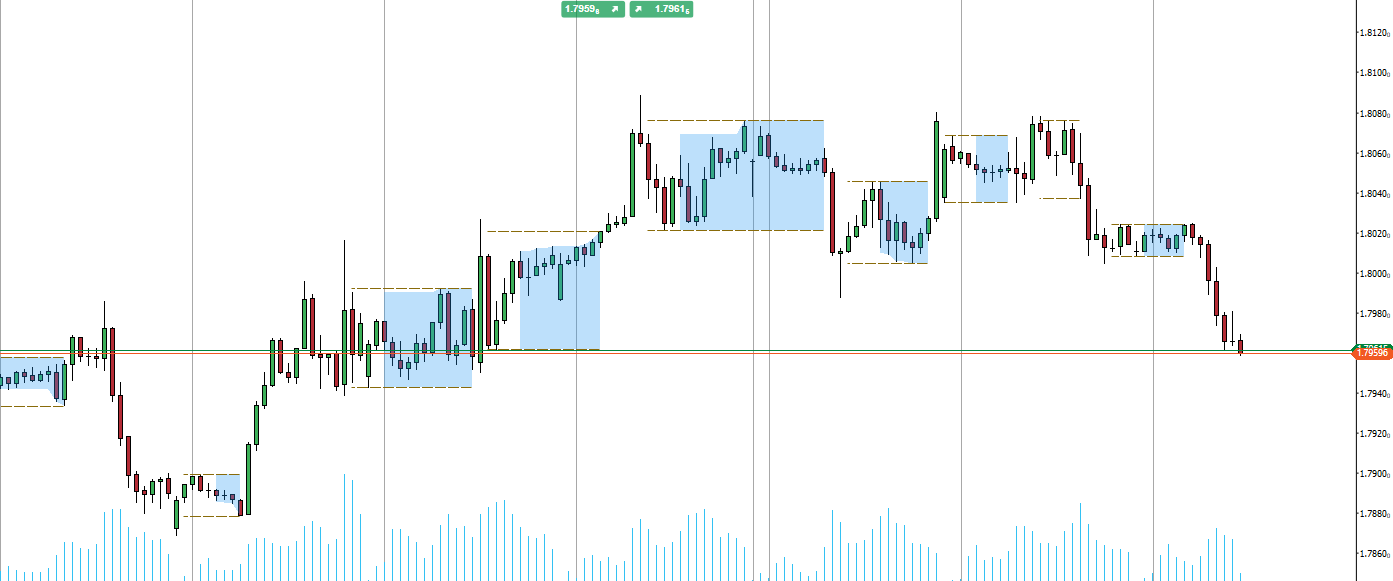
Retracement Band (rectangle)
- Show Retrace Band Rectangle – Draw the visual band.
- Retrace Rect Color (Long/Short) – Fill colors.
- Retrace Rect Opacity (0–100) – Transparency.
- Rect Extends To Now? – Stretch the rectangle to the current time.
- Show Only Current Retrace Band – Show only the most recent active impulse band (recommended).
- Band Border Thickness – Rectangle border width.
BOS Pullbacks
- Enable BOS Pullbacks – Turn BOS setups on/off.
- BOS Proximity (pips) – Tolerance to the BOS level on retest.
- Max Bars Since BOS – Recency limit from the break.
- Show BOS Debug – Optional helper line/text for troubleshooting.
Tips
- Use a higher SR timeframe (e.g., H4/D1) for cleaner levels, then trade on a lower chart.
- Start with 38.2–61.8% for the band; widen/narrow based on the instrument’s volatility.
- For stricter entries, use CloseAndEngulfing confirmation on a higher confirmation TF.
- Signals use Bid for longs and Ask for shorts to reflect executable prices.
What’s included
- Indicator only (no automated orders).
- Works on all symbols/timeframes supported by cTrader.
Disclaimer
Markets involve risk; you are responsible for any trading decisions and results.


.jpg)