
Description
🌟 **What is the Z-Score?** 🌟
• **Z-Score in Trading**: It’s a way to measure how far the current price is from its recent average, expressed in terms of standard deviations. 😊 A value close to 0 indicates that the price is near its mean, while high values (positive or negative) 😮 indicate that it has deviated significantly.
• **Statistical Utility**: These values allow you to identify situations where the price is "overbought" 📈 or "oversold" 📉, which can be useful for mean reversion strategies or for detecting moments of high volatility 💥.
🌟 **How the Indicator Works** 🌟
1. **Calculation of Average and Deviation**:
- A specific number of previous bars (or periods) are analyzed to calculate the average closing price and its standard deviation. 🧮
- With these values, it is determined how much the current price deviates from the mean. This difference is expressed as a Z-Score.
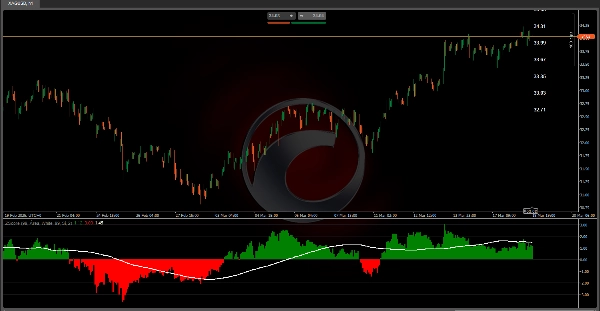
2. **Visualization of the Z-Score**:
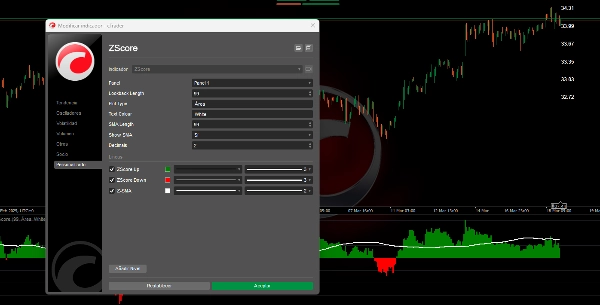
- **Area Mode**: Two histograms are displayed: one in green 🟩 for positive values (when the price is above the mean) and another in red 🔴 for negative values (when it is below). This allows you to visually identify the magnitude and direction of the deviation.
3. **Moving Average of the Z-Score**:
- A moving average is calculated over the Z-Score values. This helps smooth out fluctuations and identify trends in how the price deviation behaves over time. 📊
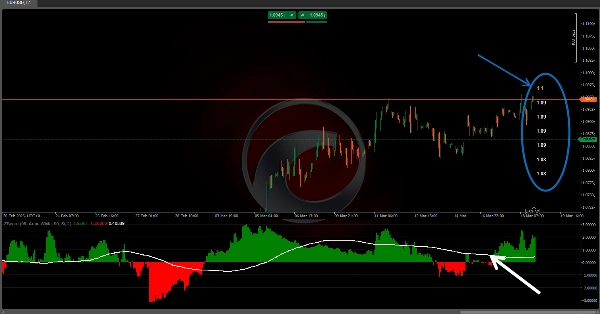
4. **Probability Zones and Reference Labels**:
- Additionally, labels are placed on the chart showing the prices corresponding to the mean and each level of deviation. This is useful for understanding, in price terms, how "extreme" the market is behaving. ⚠️
---
🌟 **Interpretation and Application for Traders** 🌟
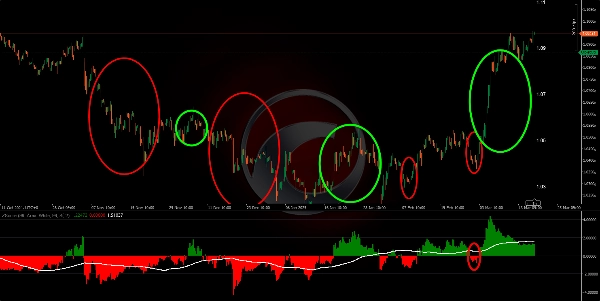
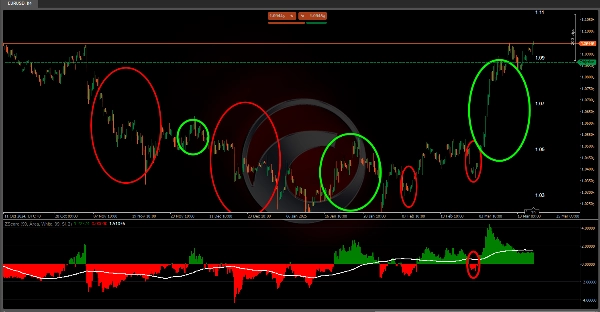
• **Detection of Extremes**: By observing very high or very low values in the indicator, a trader can identify that the price has significantly moved away from its average. This may suggest that a correction is likely (if expecting mean reversion) 🔄 or that a strong breakout is occurring.
• **Trend Confirmation**: The moving average of the Z-Score and associated bands allow you to see changes in the price behavior trend relative to its mean. A cross or change in these lines can be interpreted as an entry 🛡️ or exit signal.
• **Risk Management**: By knowing the levels of deviation and probability zones, you can adjust position sizes or define stop loss ⬇️ and take profit ⬆️ points, since you have a reference for normal versus extreme movements.
• **Statistical Understanding of the Market**: Beyond being just a graphical tool, this indicator encourages thinking about market behavior in probabilistic terms. Knowing the "normality" of a movement can be a decisive factor when evaluating trading opportunities. 🎯
🌟 **Conclusion** 🌟
This algorithm converts price data into a statistical representation that helps visualize and quantify the deviation of the price relative to its recent behavior. By combining the Z-Score, a moving average, deviation bands, and a probability table, the indicator provides multiple layers of information. This makes it especially valuable for identifying moments when the market is in unusual conditions, facilitating entry 🚀, exit 🛑, and risk management decisions based on probability and statistics. 📈📉
Ctrader Store indicators:
Dynamic Market Structure
Analysis of Turning Points
Fibonacci Linear
Regression Multi-timeframe
Multi-Level Candle Bias
Tracker
Auto Support and
Resistance Trend Lines
Summary
Customer reviews
5 | 100 % | |
4 | 0 % | |
3 | 0 % | |
2 | 0 % | |
1 | 0 % |


