PriceLevels
03/09/2025
4
Desktop
Since 05/01/2025
Sales
5
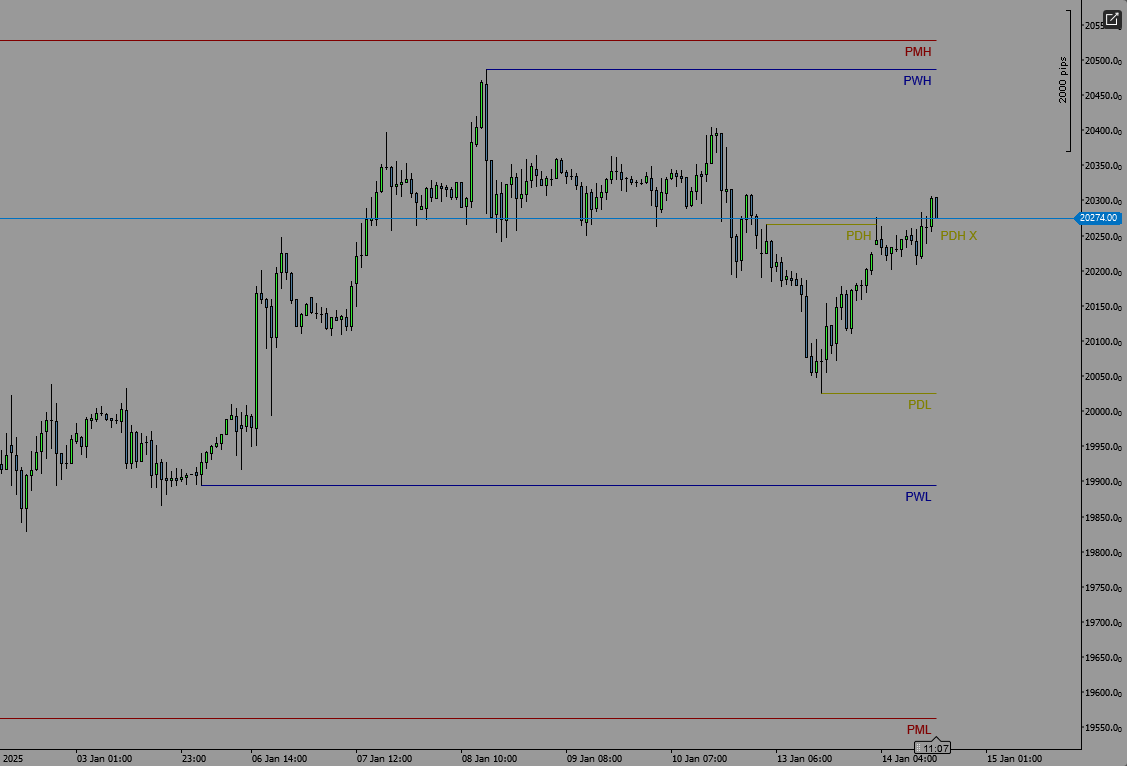
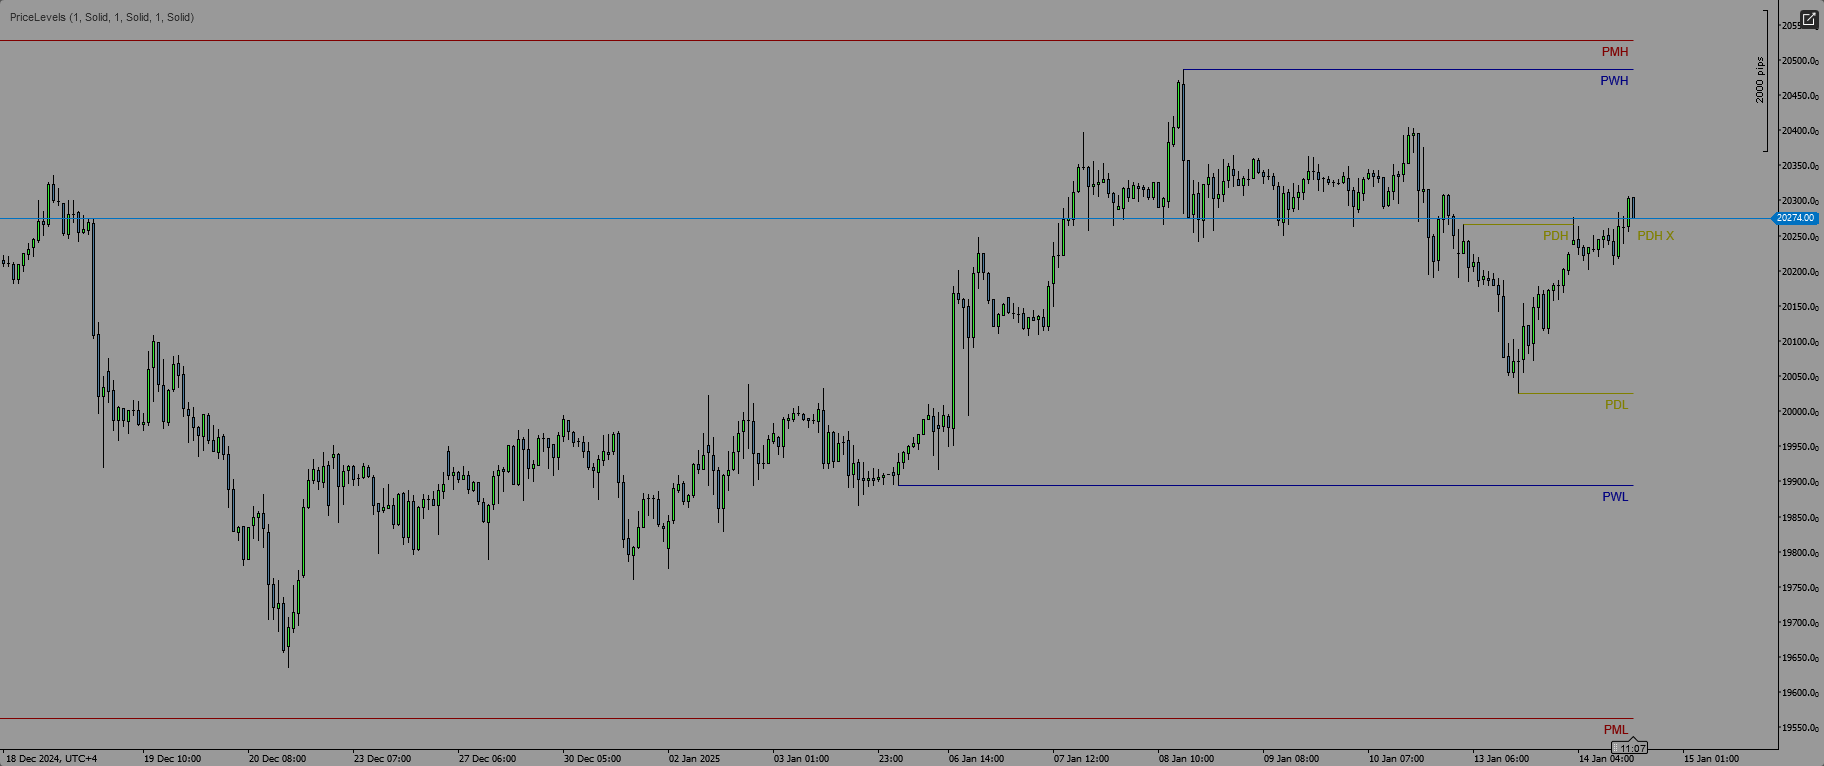
Key Features:
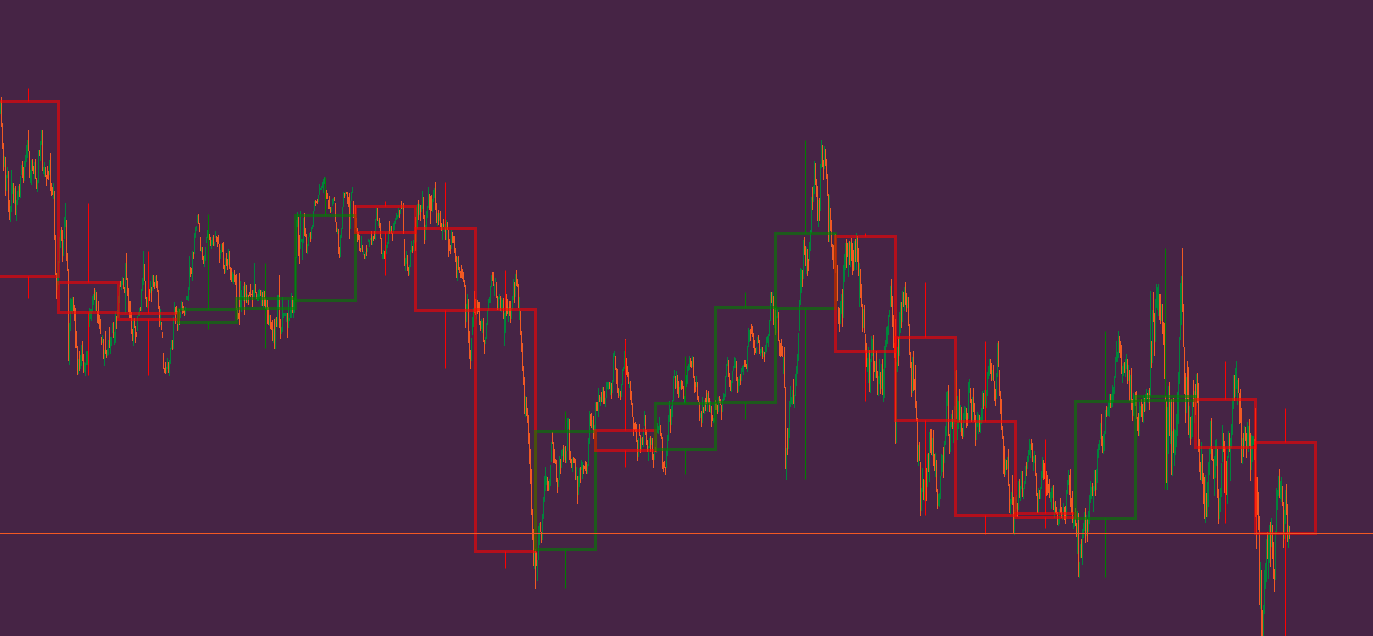
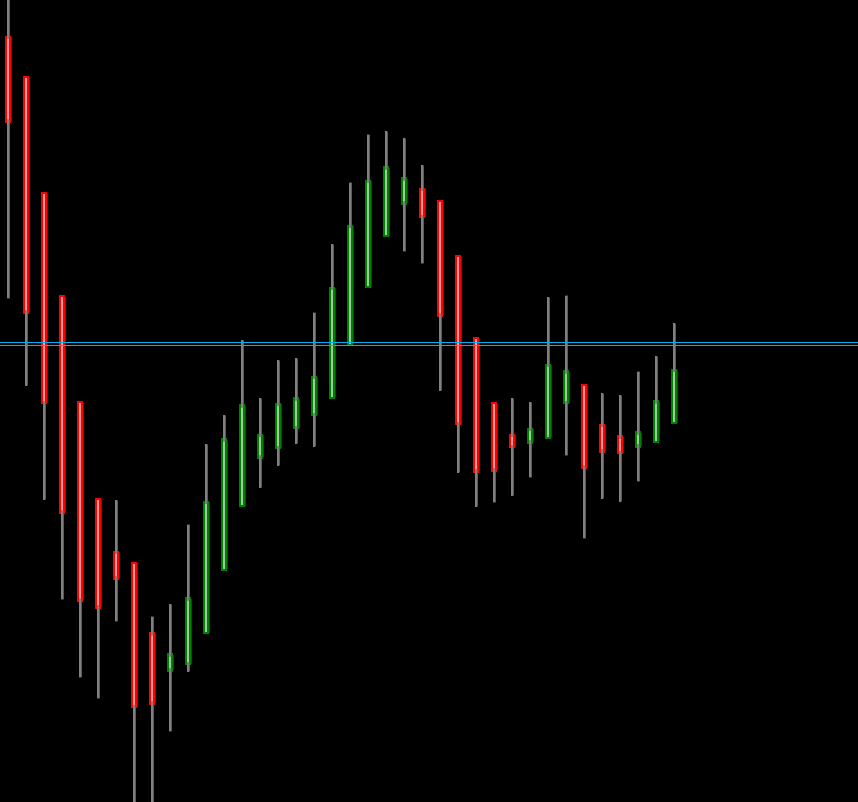
- Displays yesterday's high and low levels.
- Displays last week's high and low levels.
- Displays last month's high and low levels.
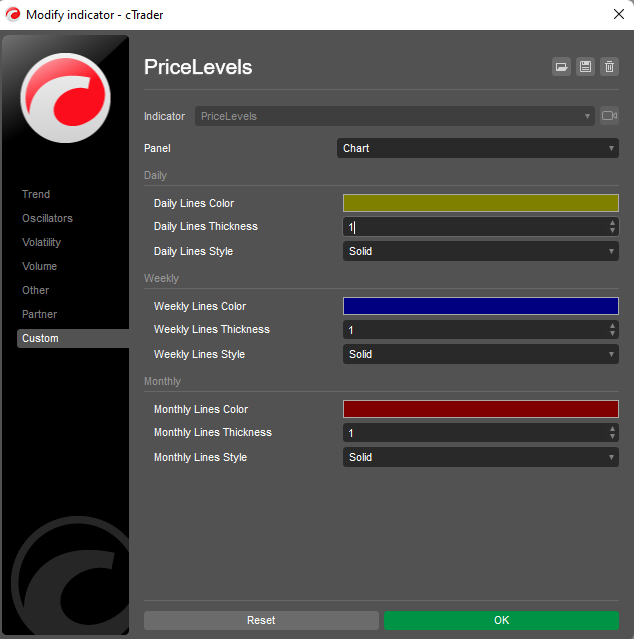
- Customizable colors and line styles for each level.
How It Works:
The indicator automatically calculates the highest and lowest prices for the previous day, week, and month based on your chart's timeframe. These levels are then plotted as horizontal lines on your chart, providing a clear visual reference for historical price action.
Compatibility:
- Designed for cTrader platform only.
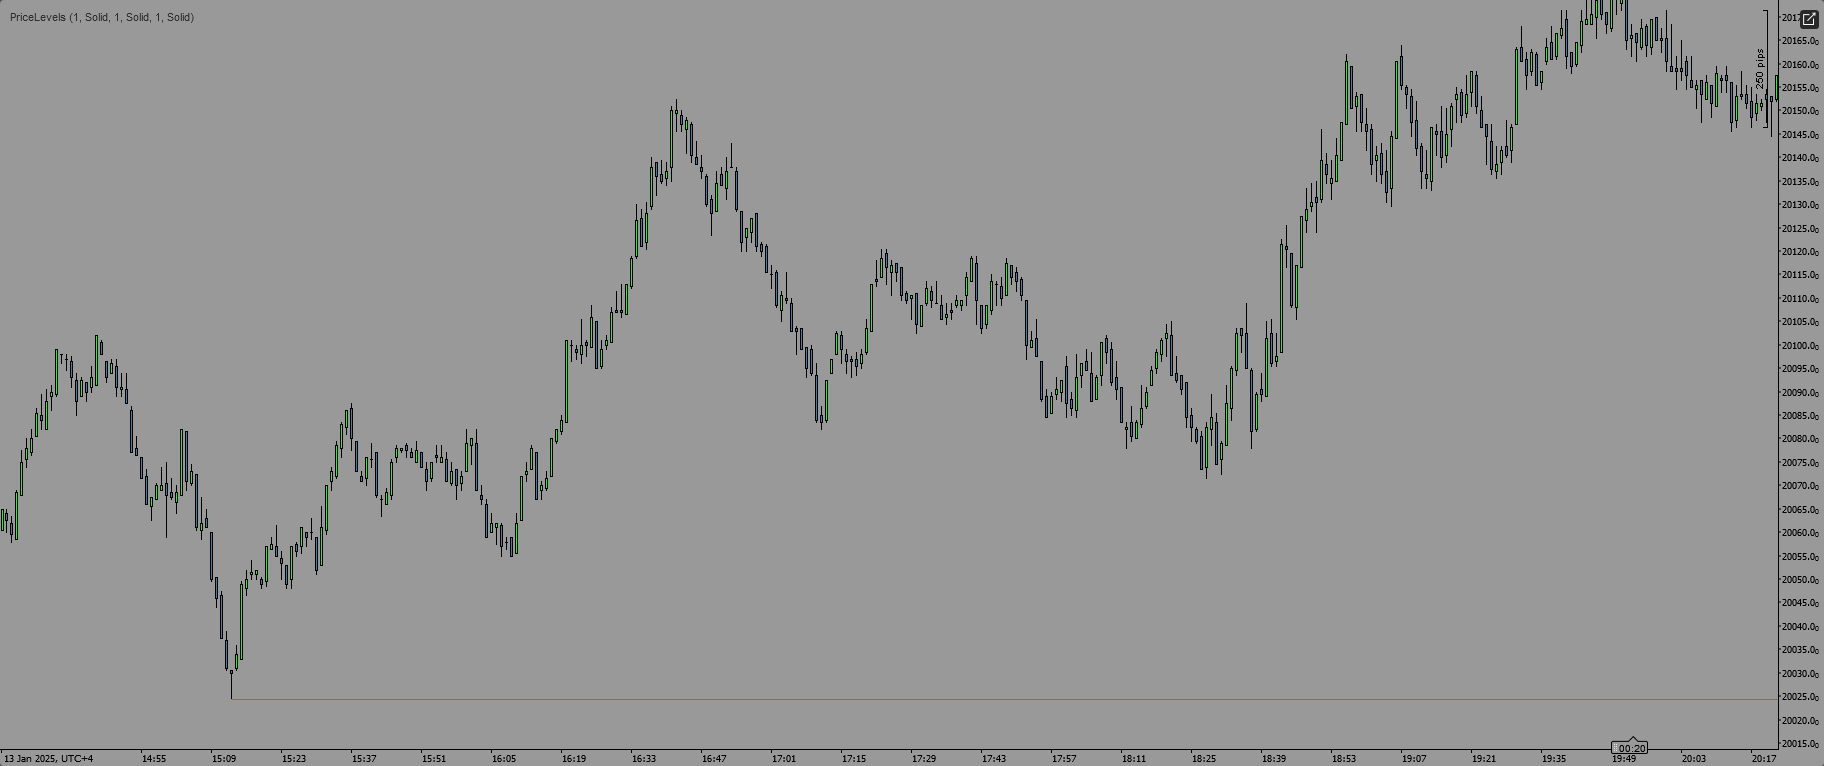
- Works on all timeframes and instruments.
If you have any questions, feedback, or suggestions for improvement, feel free to reach out! Your input is highly valued and will help make this indicator even better.
Happy trading!
More from this author


You may also like
!["[Stellar Strategies] BOS Trend 1.0" logo](https://market-prod-23f4d22-e289.s3.amazonaws.com/808c7722-ba53-4633-b8a4-16f31eeb1fc2_[Stellar Strategies] BOS Trend.jpg)


.jpeg)

!["[Stellar Strategies] Wave Trend Pro" logo](https://market-prod-23f4d22-e289.s3.amazonaws.com/8c93438a-6b0a-4026-93b2-0694329a3bc1_cT_cs_4141285_EURUSD_2025-04-25_17-52-31.png)