E7 Free Overlay Indicators include only the following
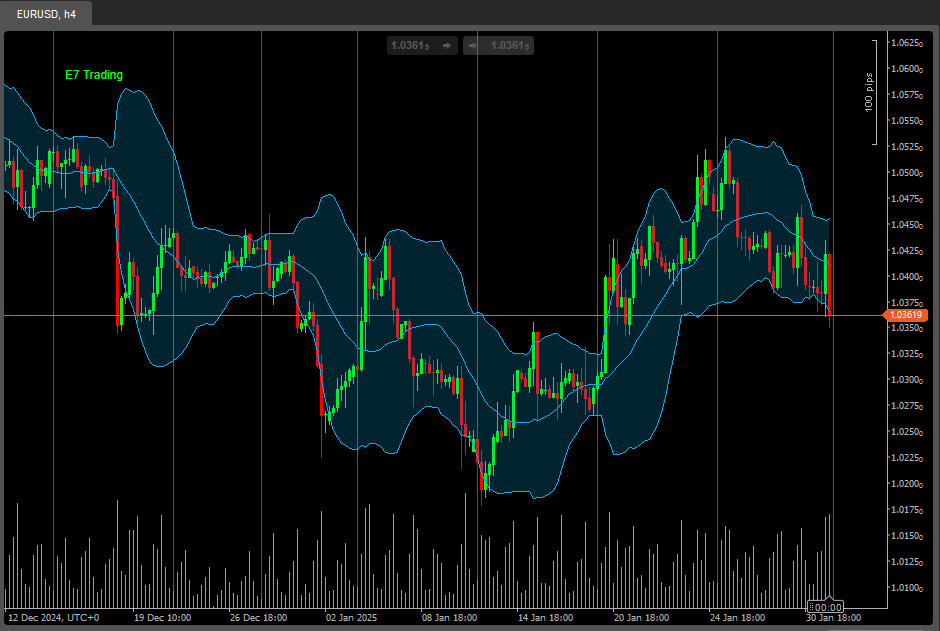
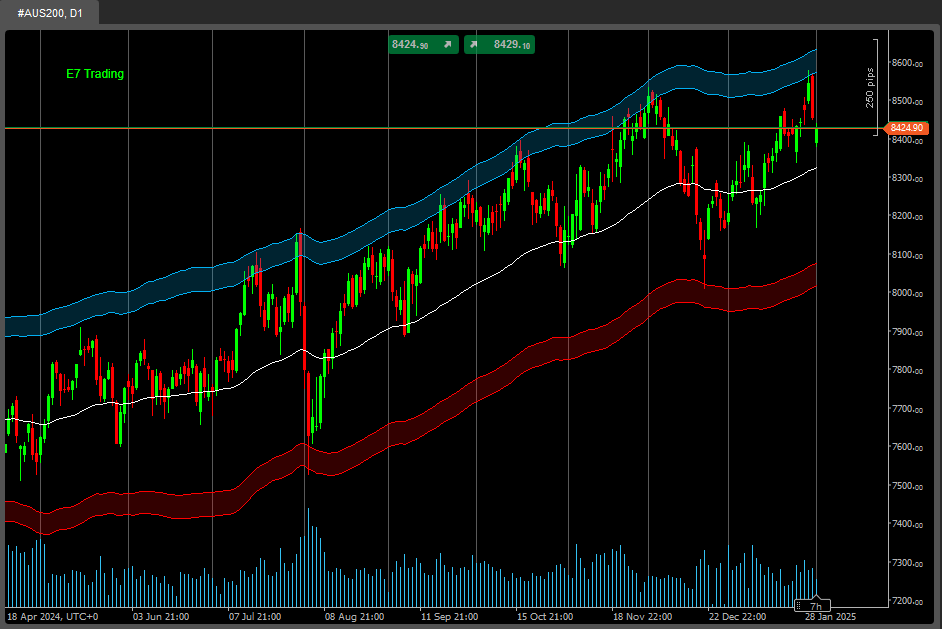
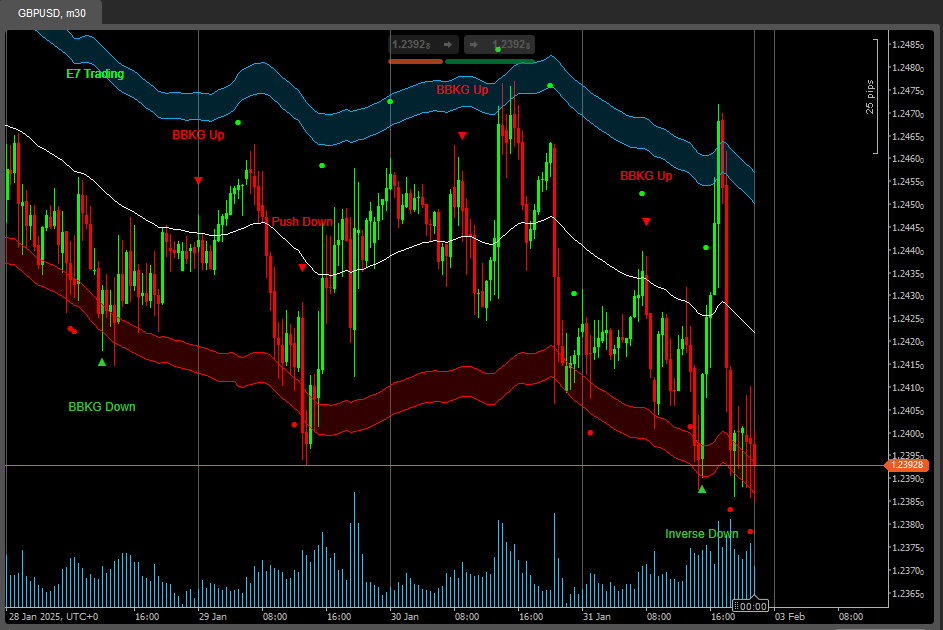
- Bollinger Band Cloud
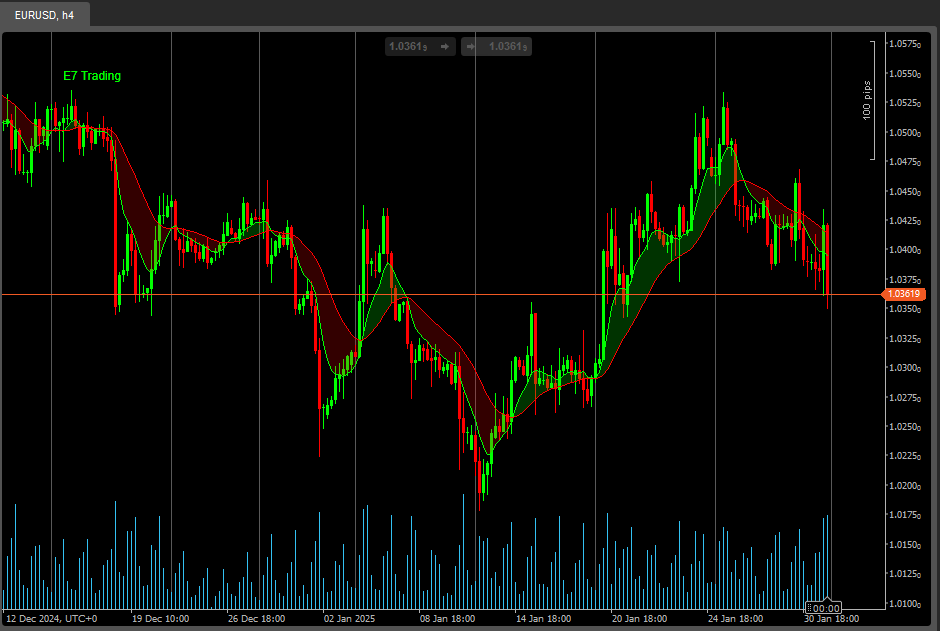
- Heiken Ashi
- Trend Follower
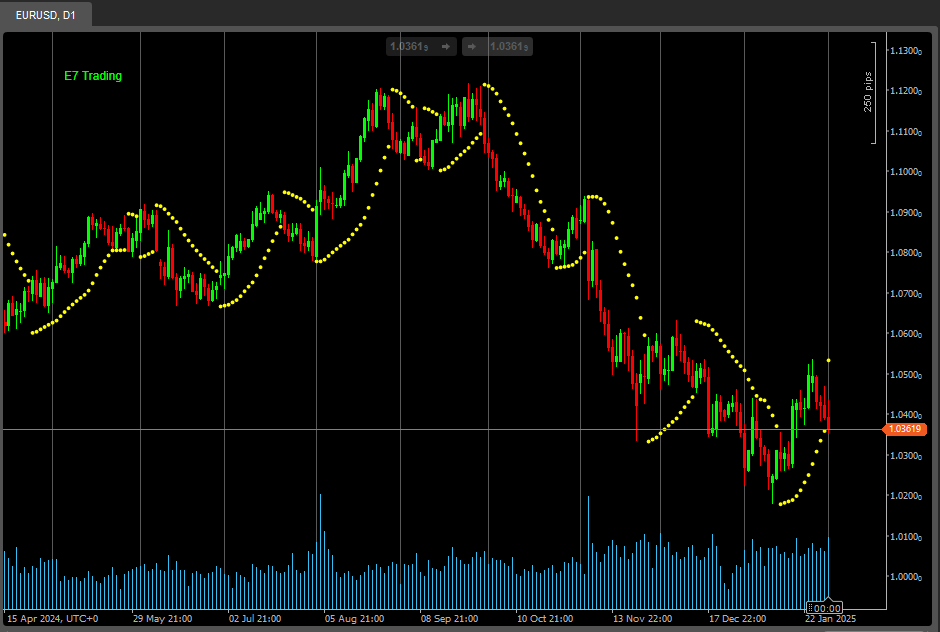
- Parabolic SAR.
Happy hunting!


.jpg)