Indicator
NAS100
NZDUSD
Breakout
XAUUSD
Commodities
Forex
EURUSD
Bollinger
GBPUSD
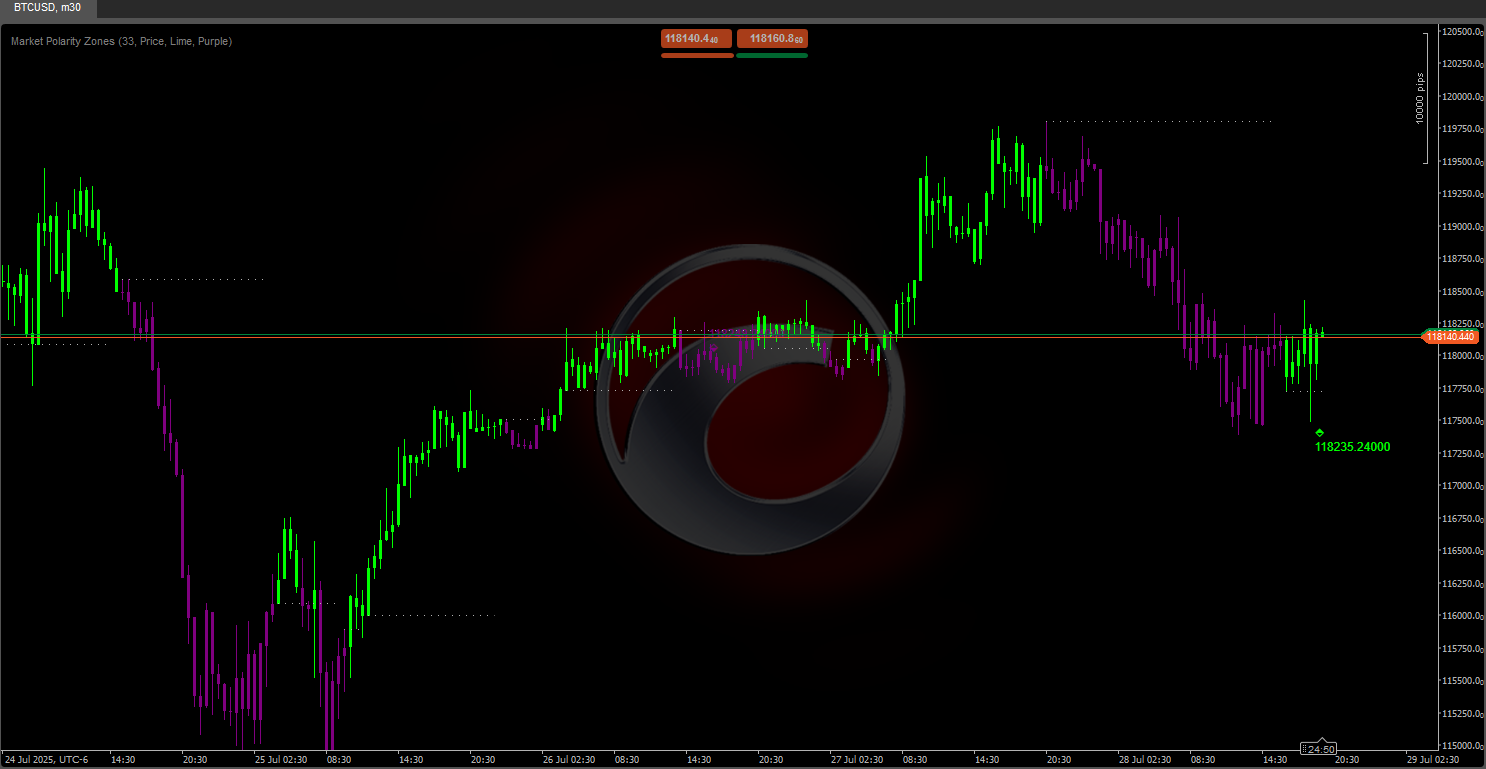
BTCUSD
Indices
Stocks
Crypto
USDJPY
Scalping
RT Bollinger Bands Cloud
25/09/2025
Desktop
Since 25/09/2024
Sales
20

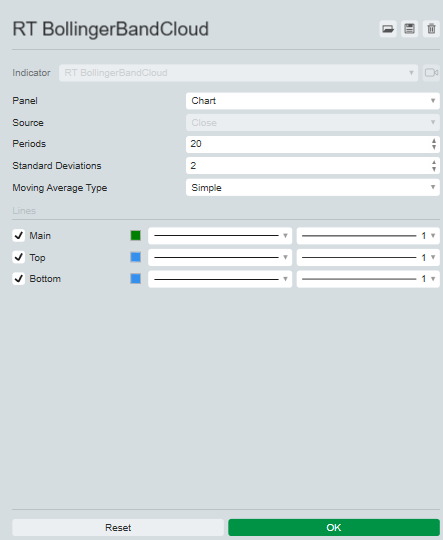
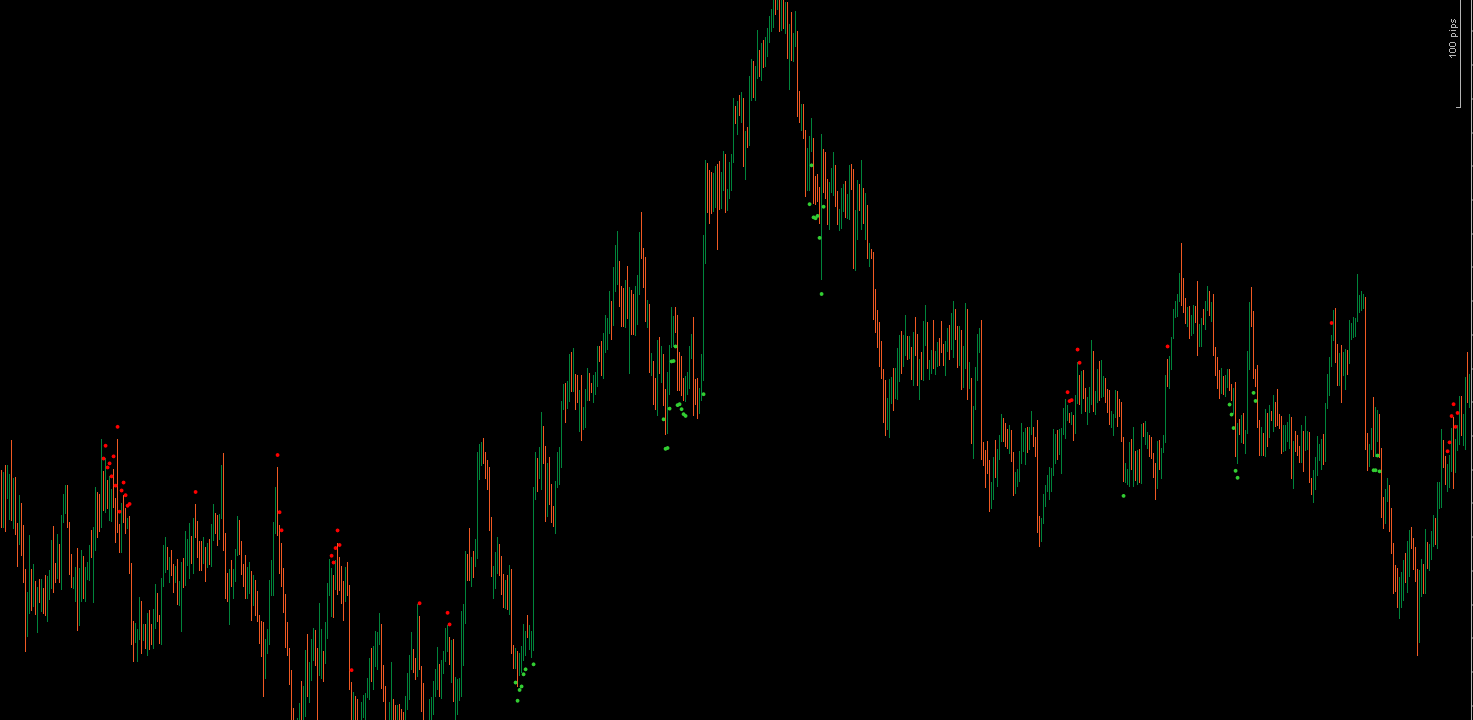
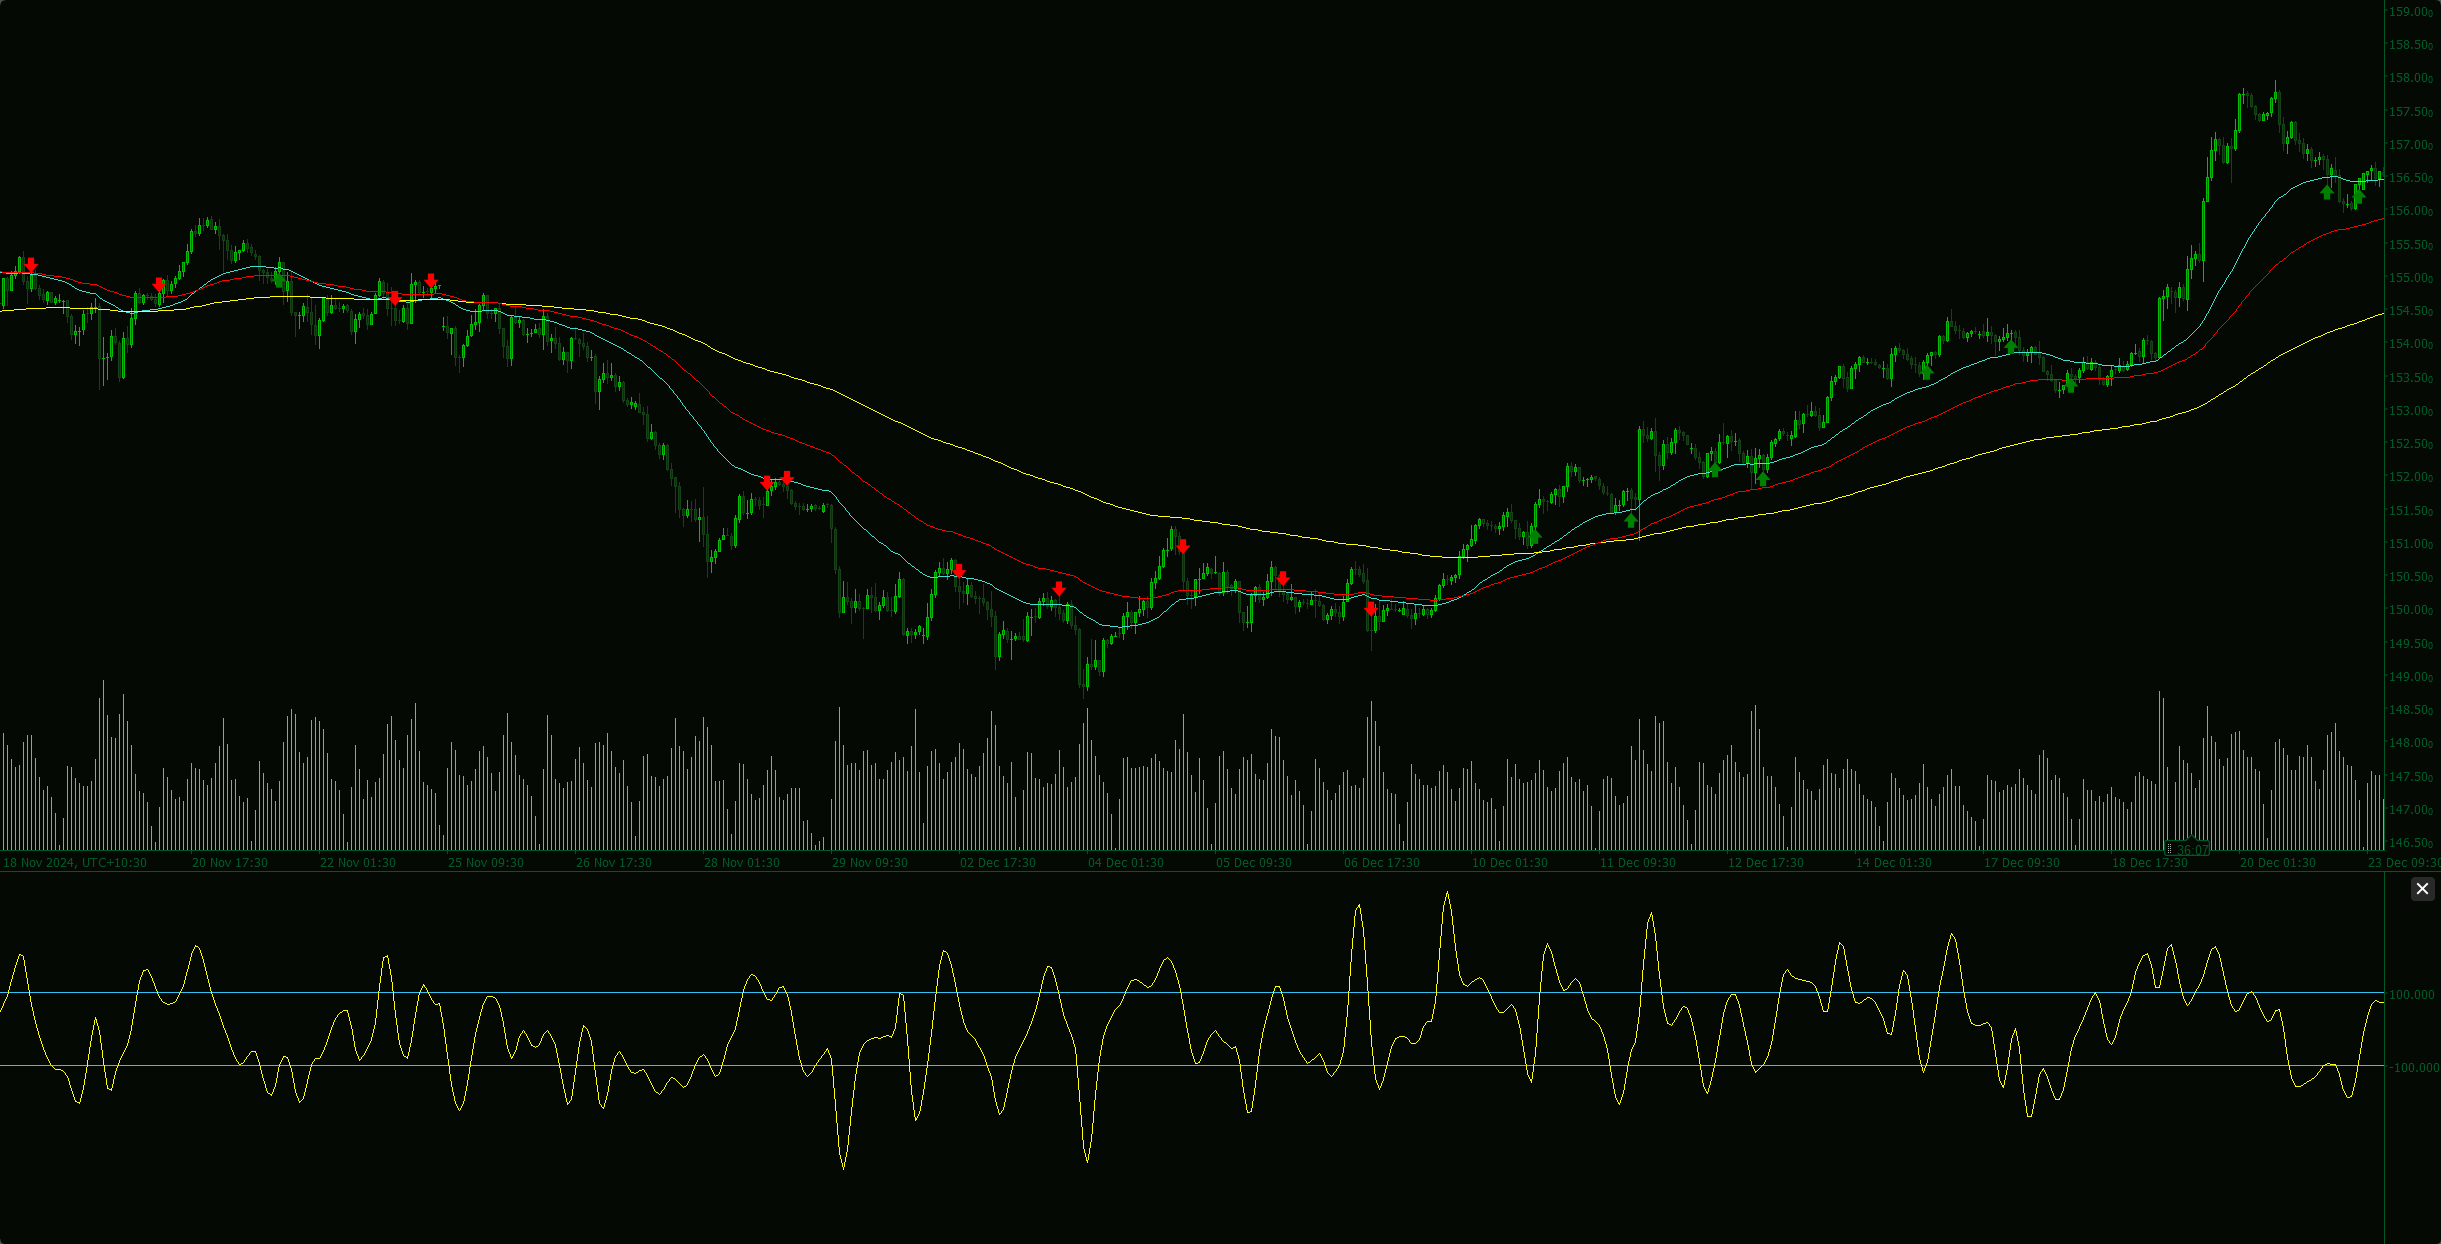
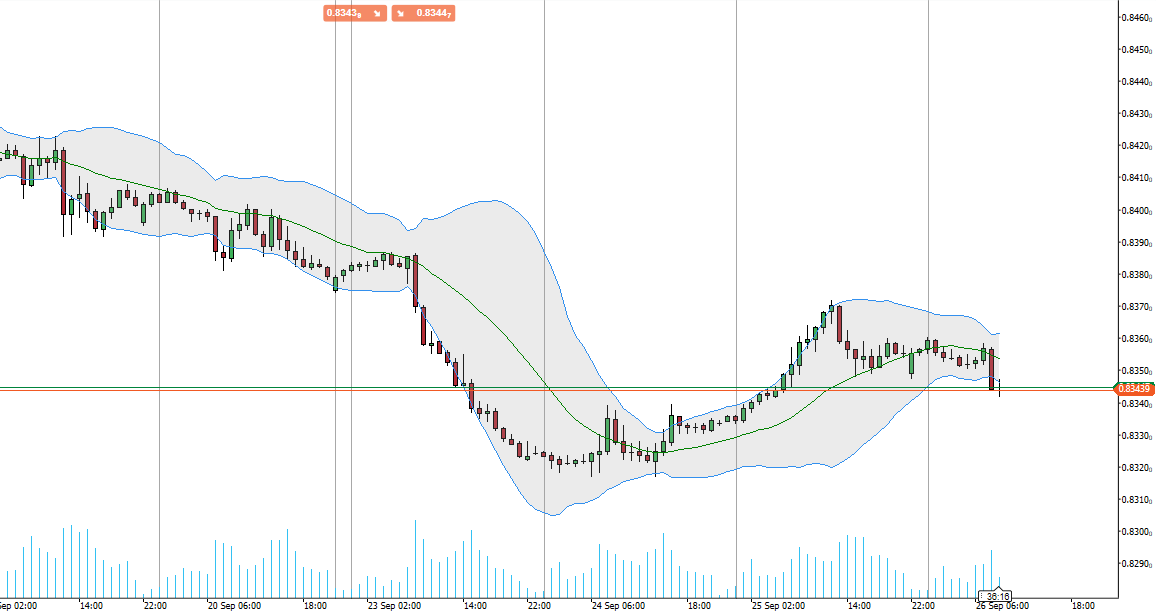
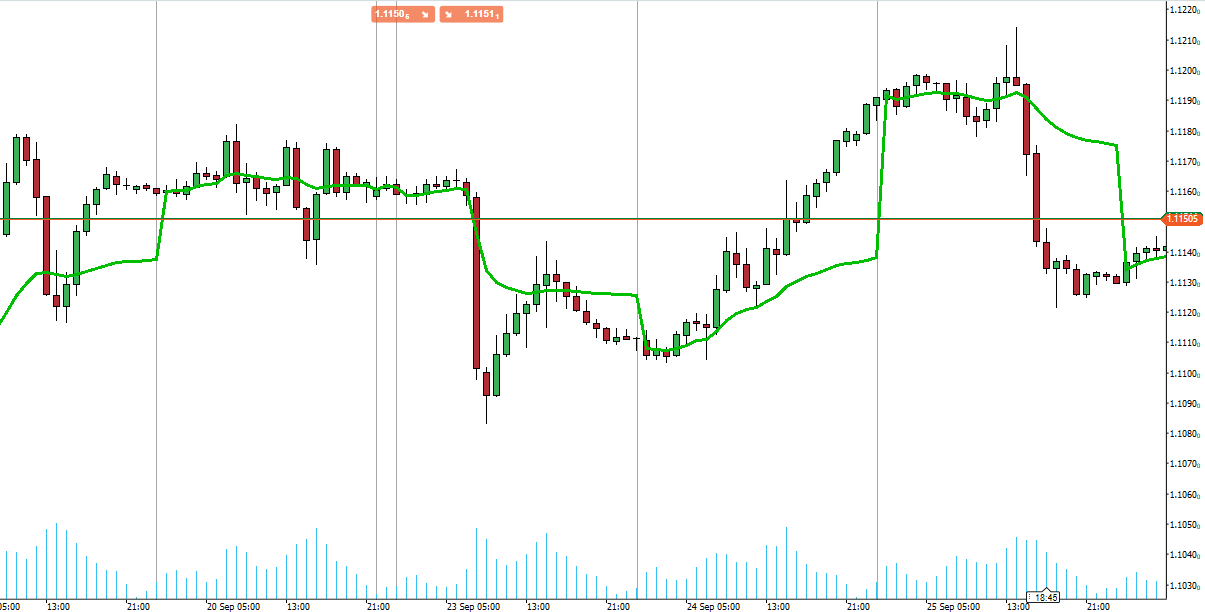
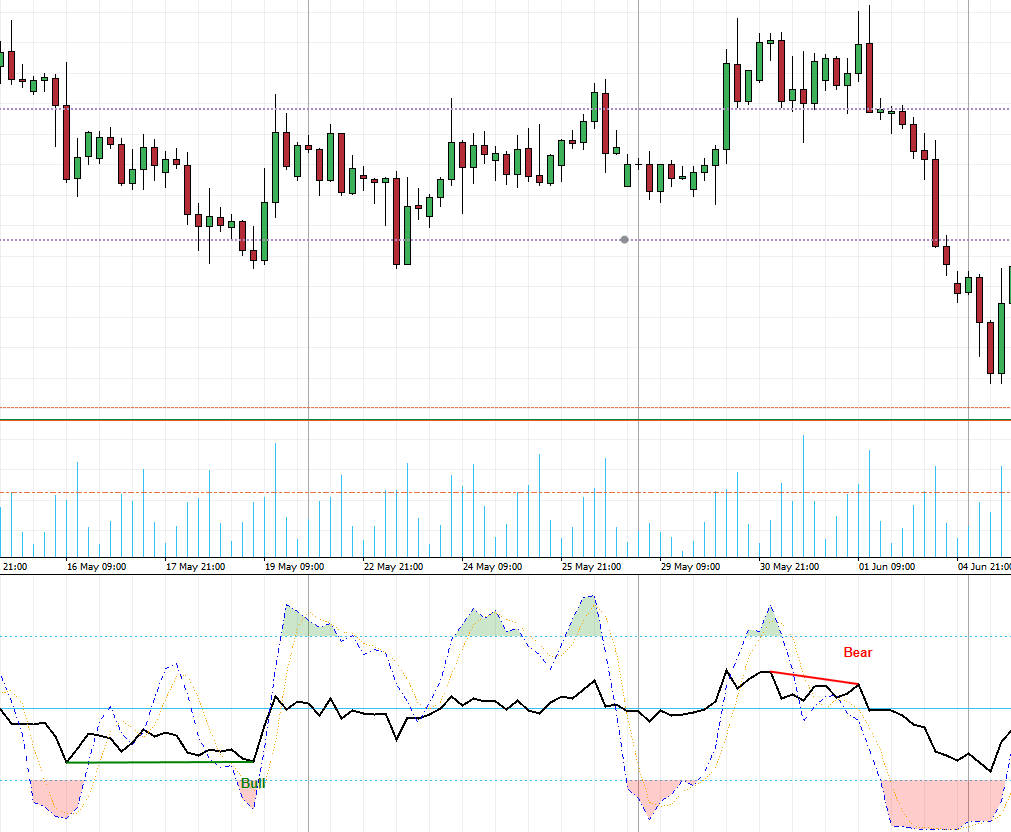
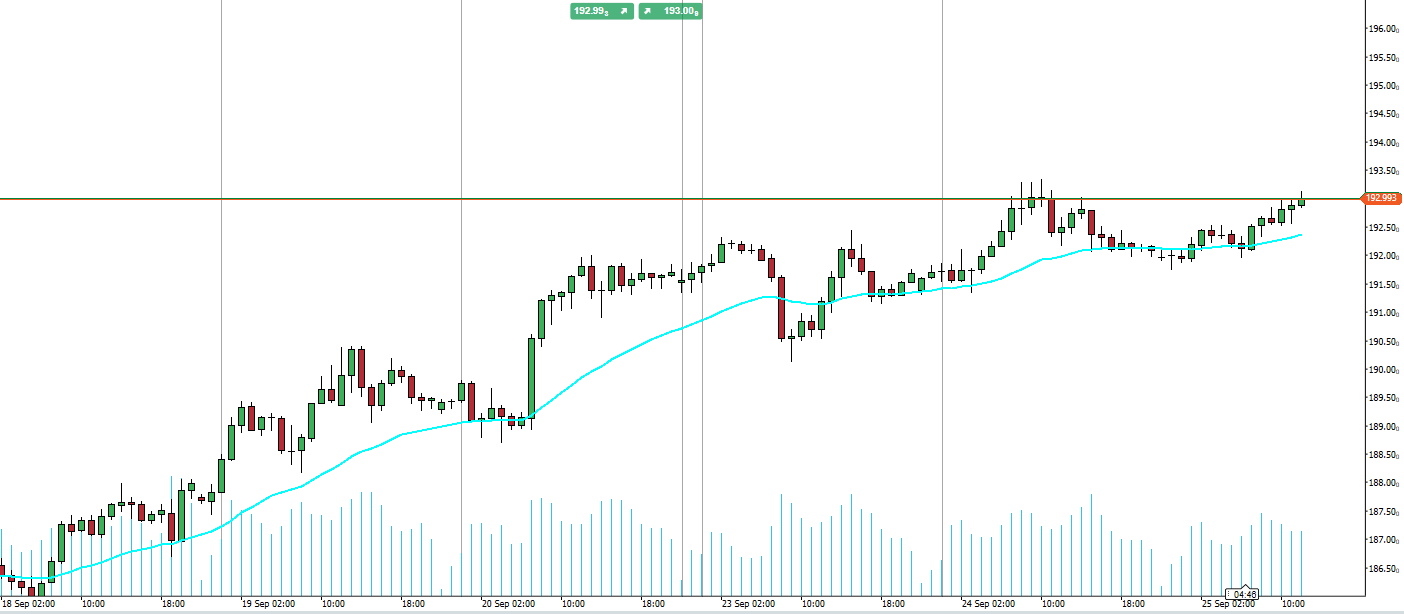
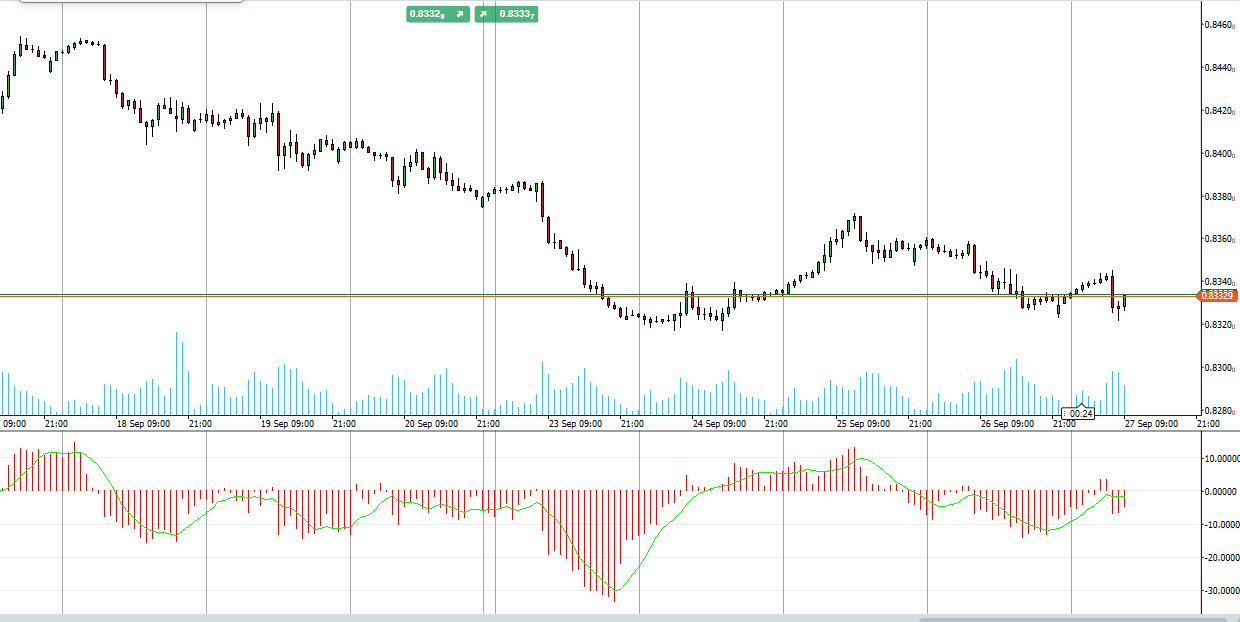
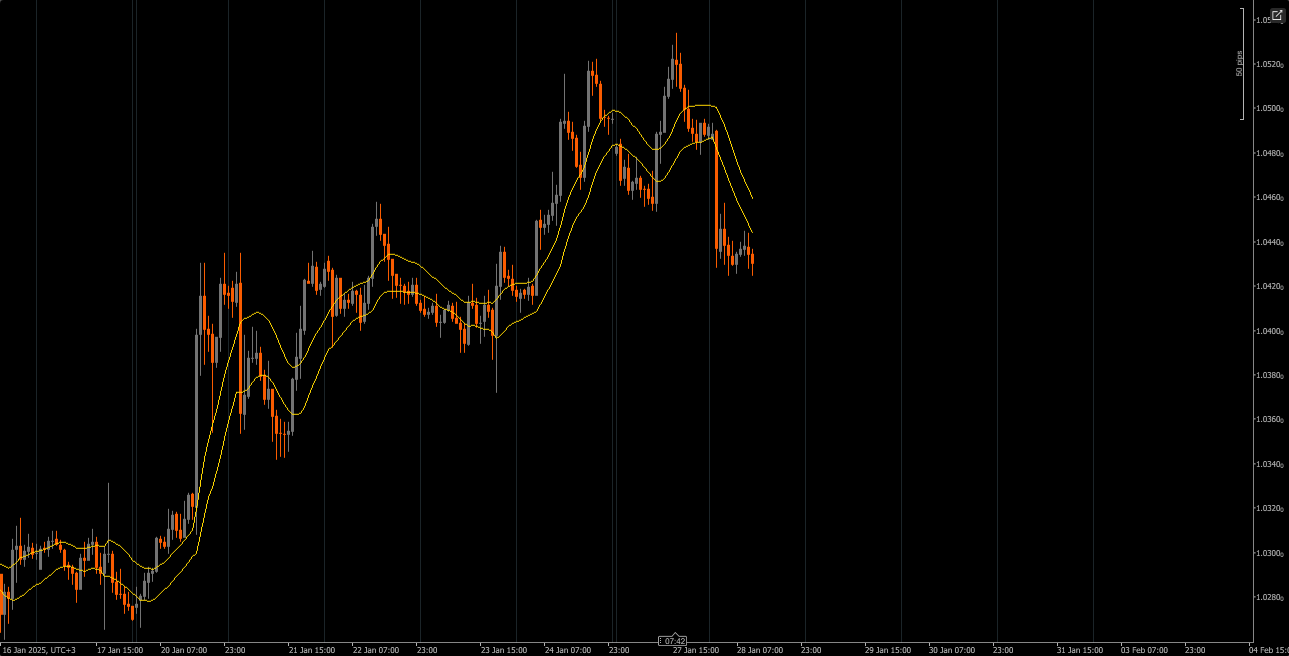
Introducing our enhanced Bollinger Bands indicator, designed to elevate your trading experience with clearer visualization.
This visual enhancement makes it easier to interpret market volatility and identify potential breakout and reversal points. Ideal for traders seeking clearer insights and improved decision-making.
Upgrade your trading toolkit today for sharper analysis and better results.
More from this author
You may also like


 (1).jpg)