Indicator
ZigZag
RSI
FVG
ATR
Supertrend
MACD
Bollinger
Ten Thousand Functions Bands Cloud(First Edition)
"Ten Thousand Functions Bands Cloud(First Edition)" logo
29/09/2025
Desktop
Since 11/09/2024
Sales
3
Free installs
41
"Ten Thousand Functions Bands Cloud(First Edition)" uploaded image"Ten Thousand Functions Bands Cloud(First Edition)" uploaded image"Ten Thousand Functions Bands Cloud(First Edition)" uploaded image"Ten Thousand Functions Bands Cloud(First Edition)" uploaded image

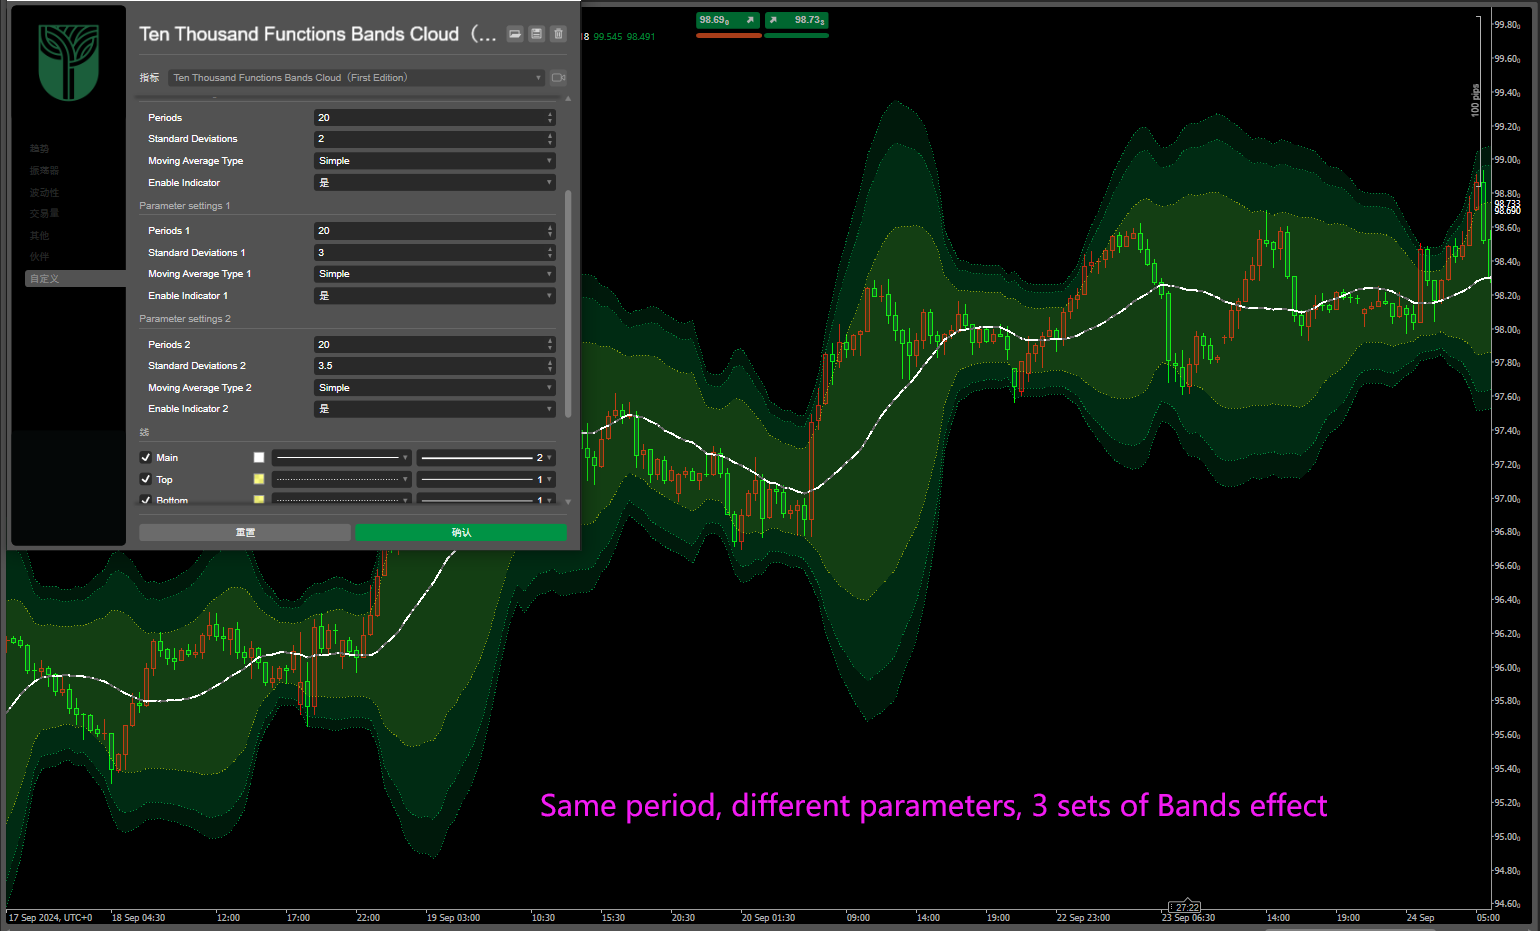
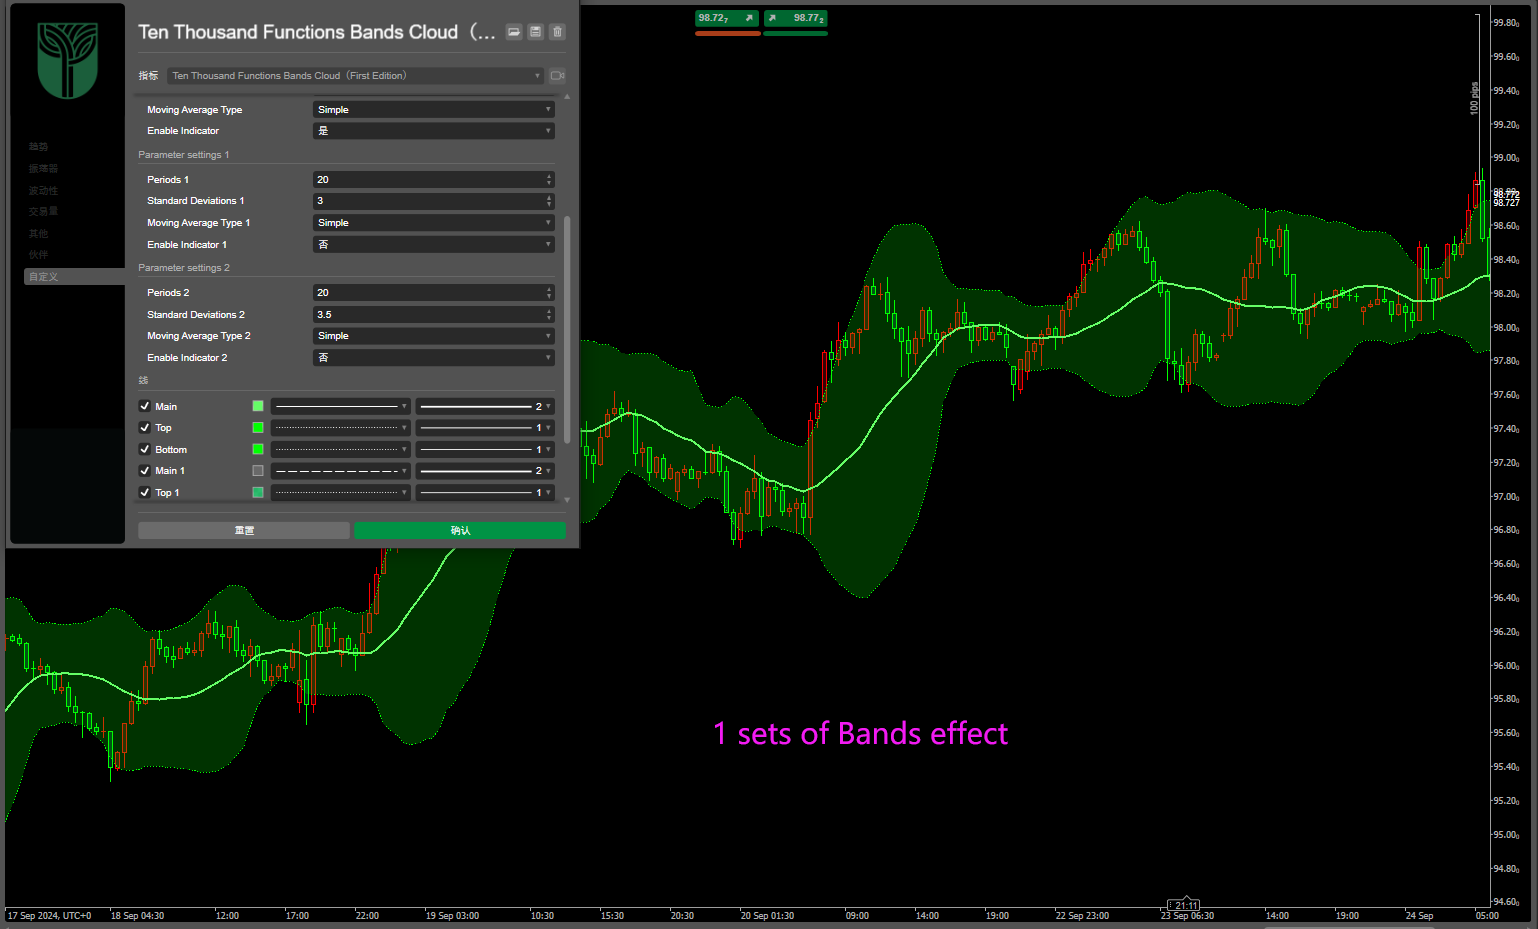
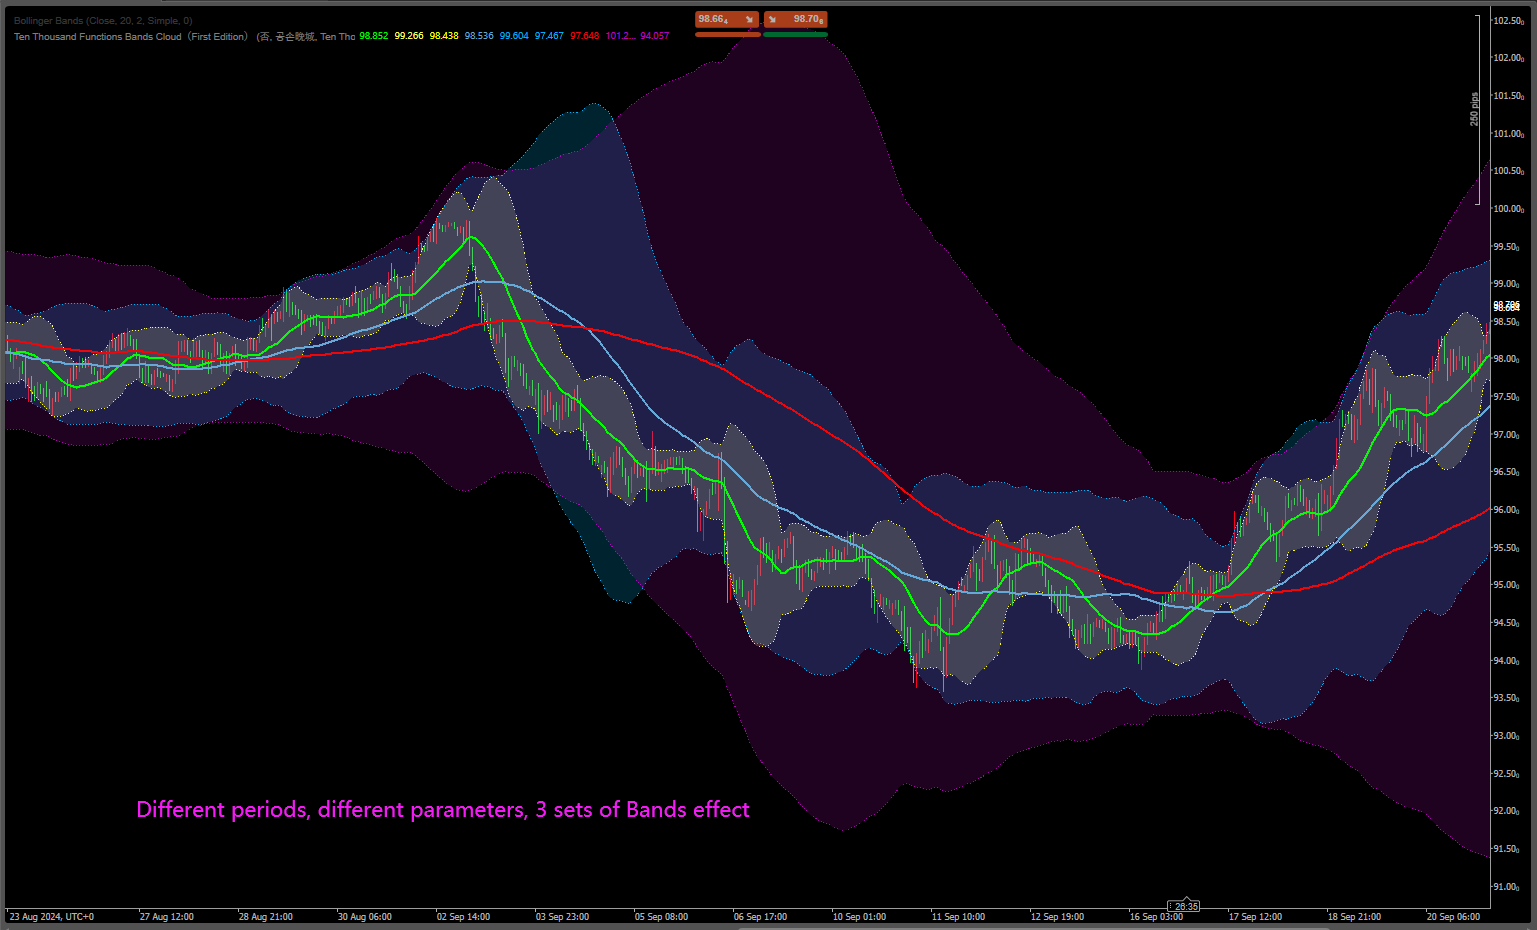
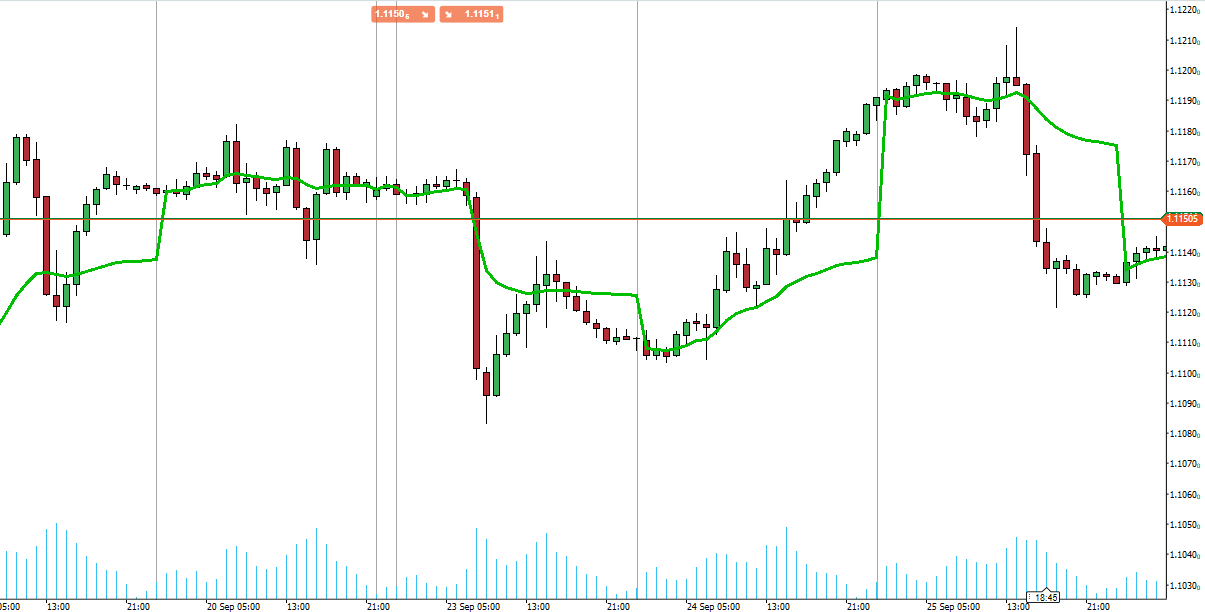
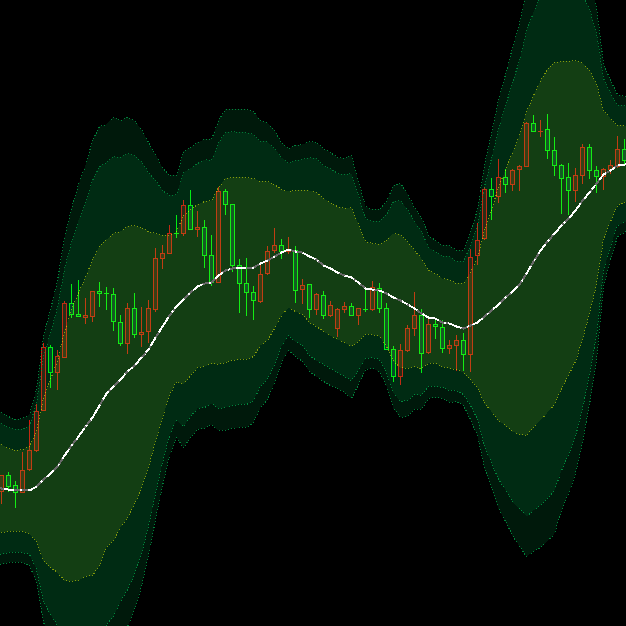
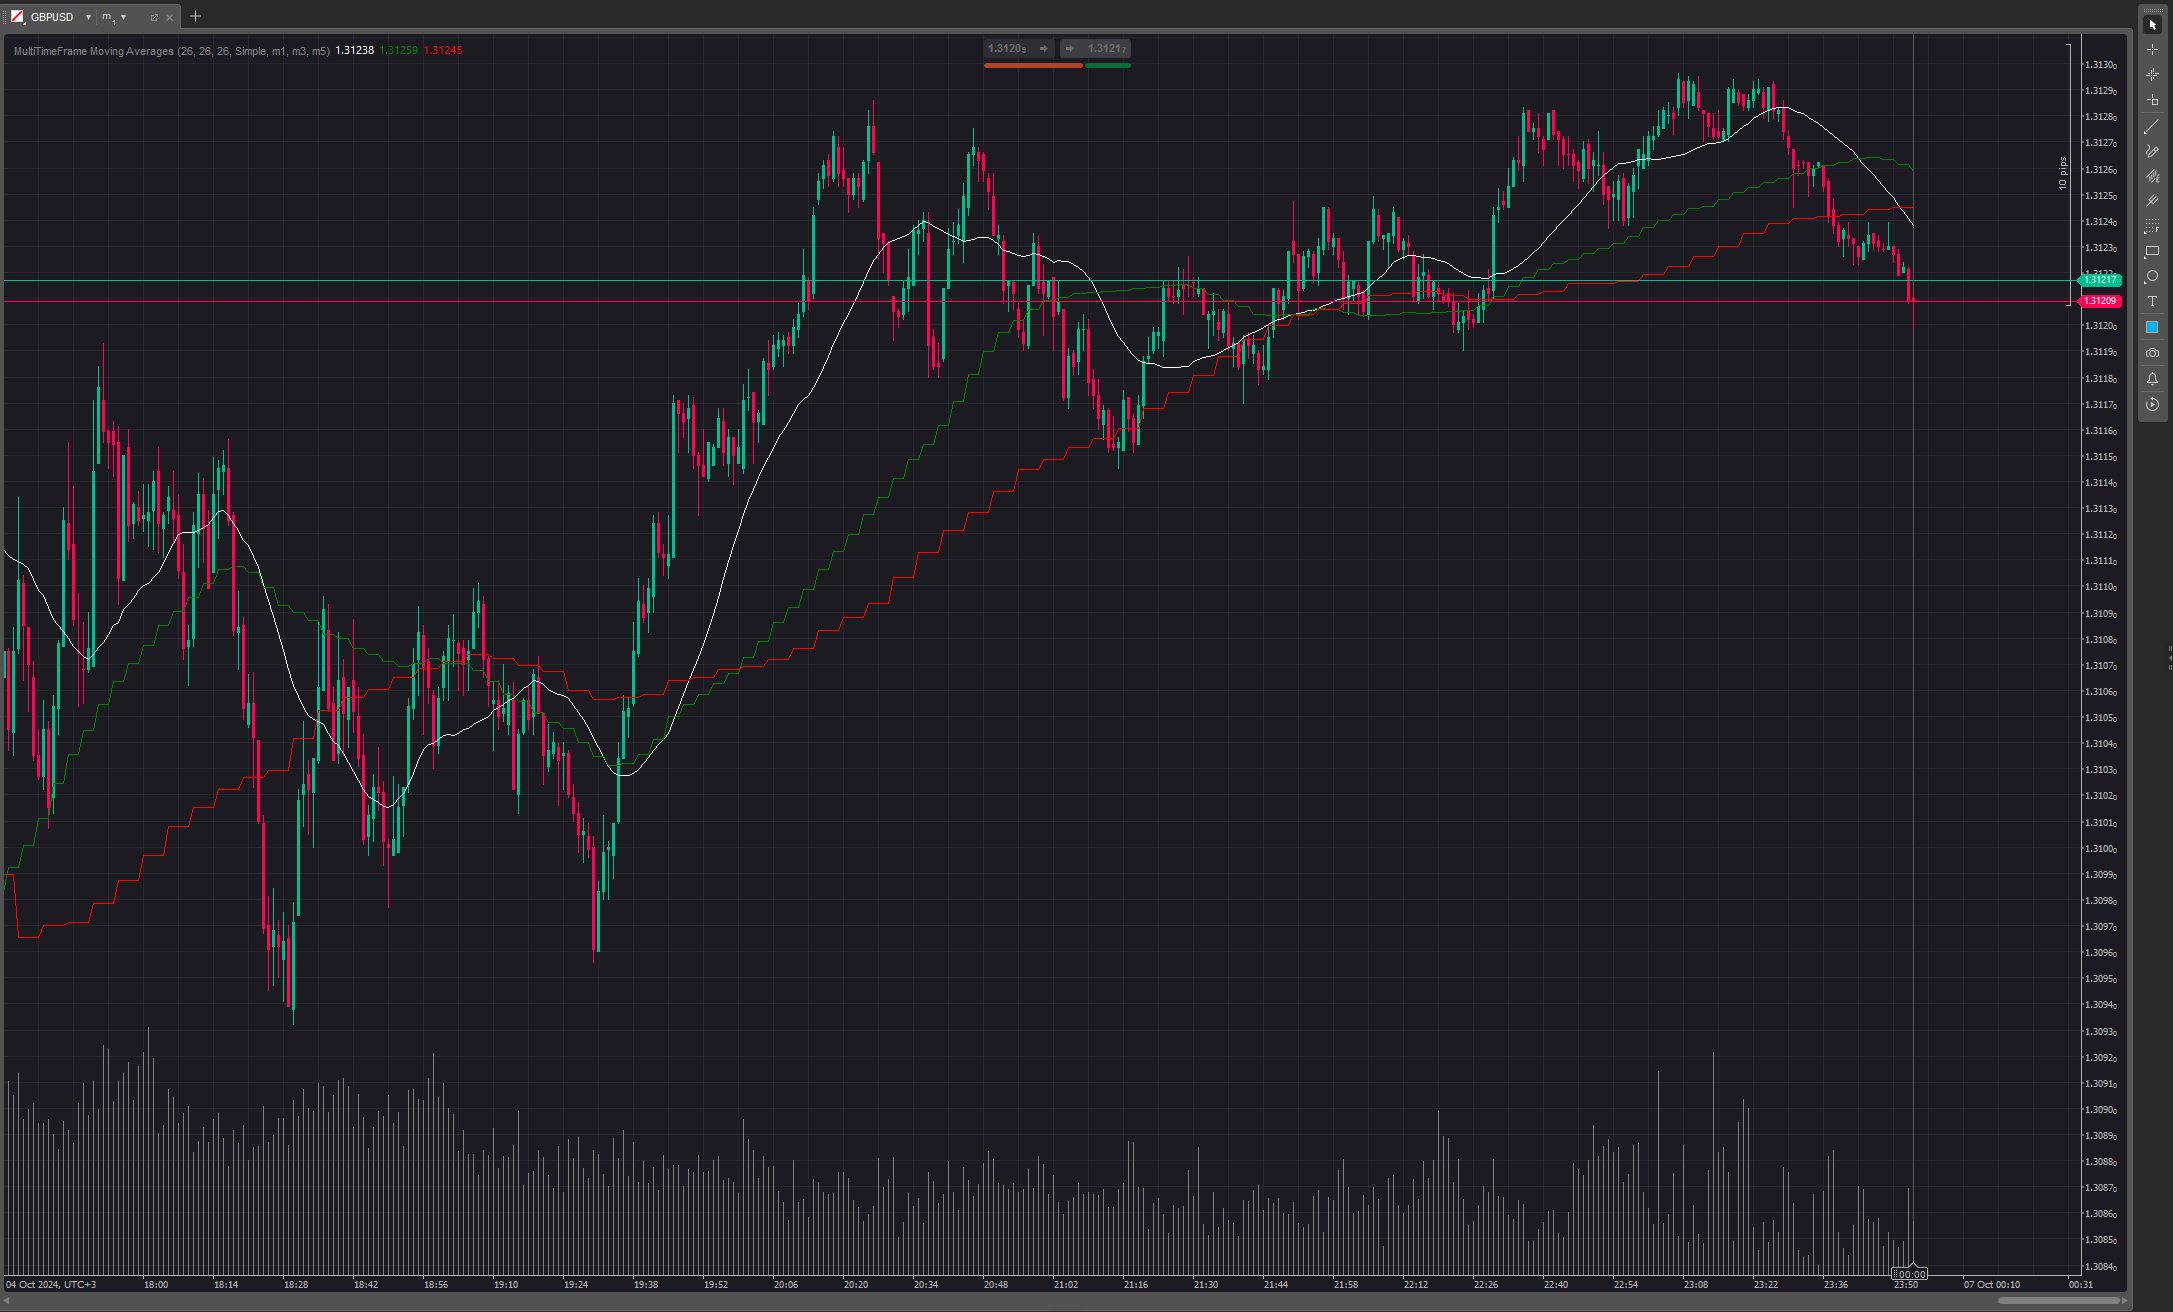
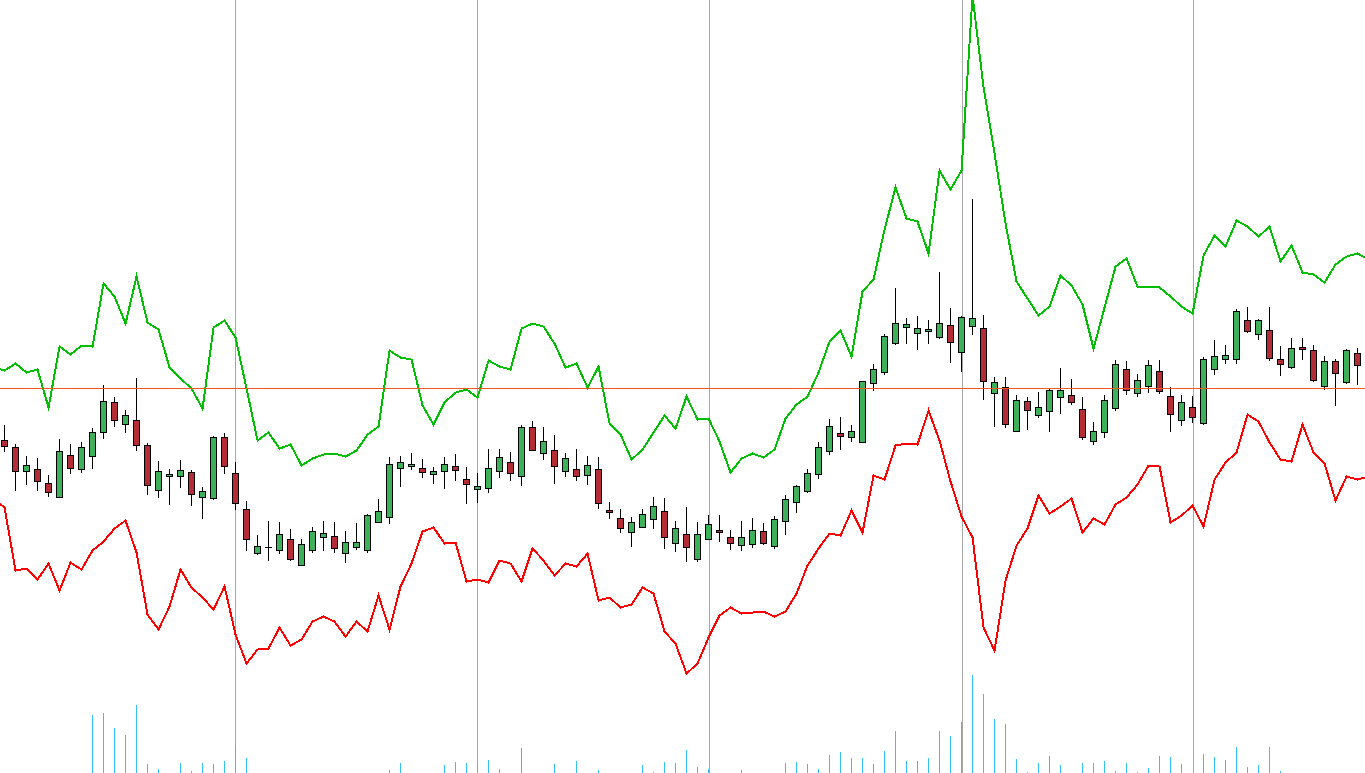
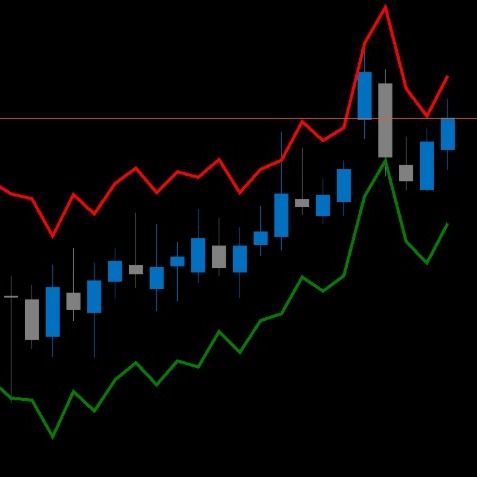
The bands we commonly use, 2.0, 2; 20,3; 20,3.5;

Empowered with cloud background!

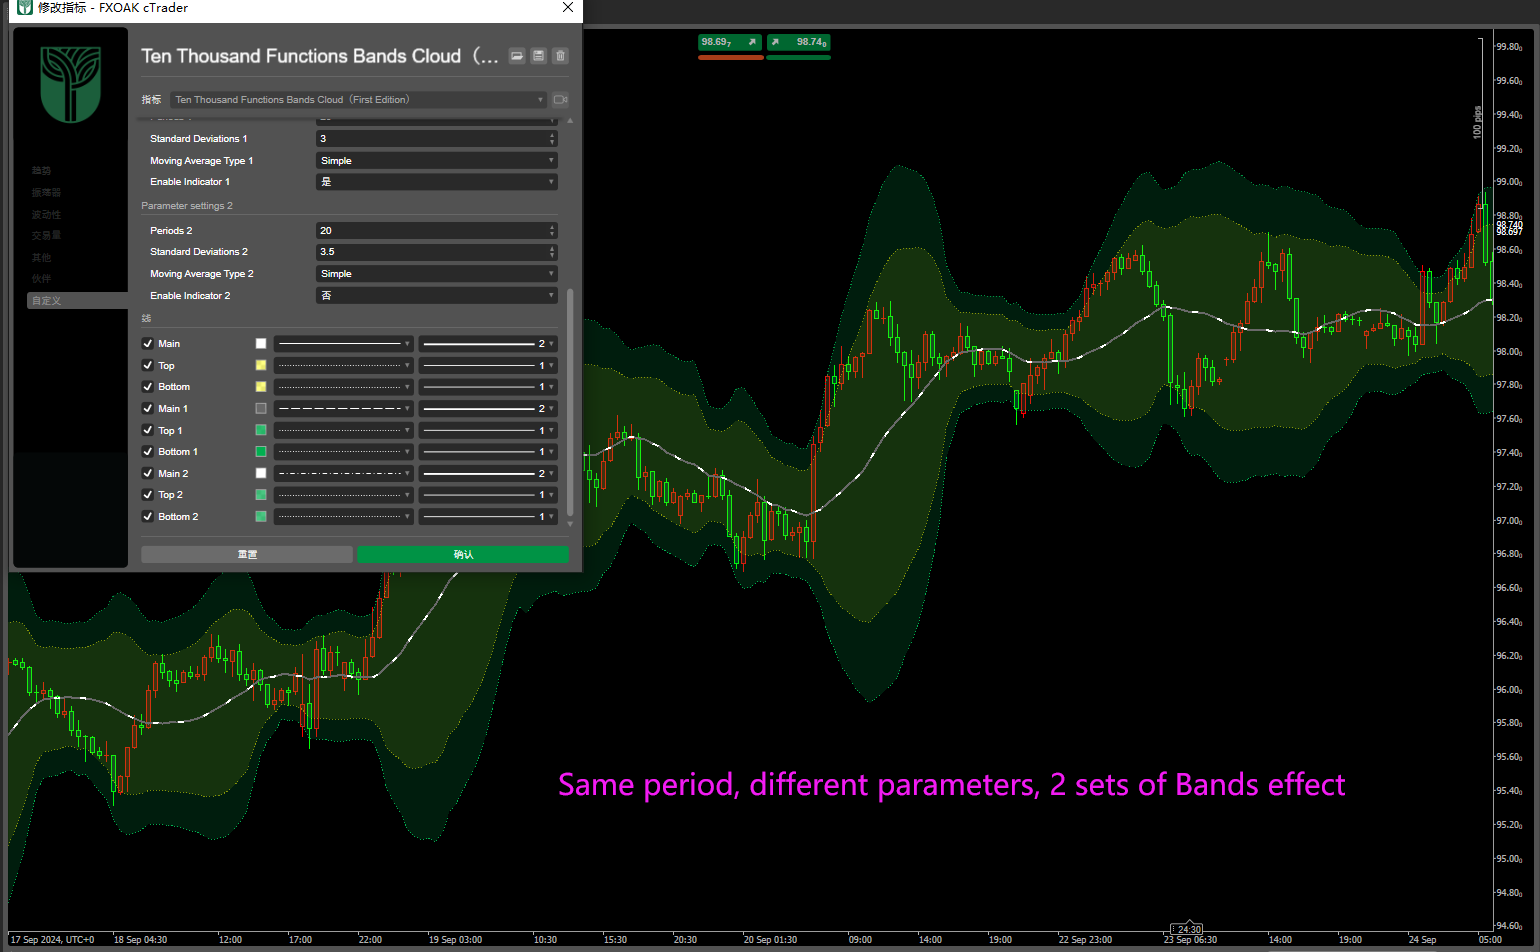
You can close or open any one or two groups; And different parameters can be modified and set!

It can also be modified to other values, such as 2.0:20, 60, 144Bands;

Bands' mid track is equal to the moving average, which is the 20, 60, and 144 moving averages!

More from this author
Indicator
VWAP
ZigZag
RSI
+5
ZigZag T3
Three ZigZag lines
Zigzag T3
Three ZigZag lines
zh-cn Variety Period clock panel(multilanguage)
This indicator can be used to: change color, shape size, position, change font, increase or decrease, and other function
RSI T3 overbought and oversold area
zh-cn Variety Period time panel(multilanguage)
This indicator can be used to: change color, shape size, position, change font, increase or decrease, and other function
RSI T3 Overbought and oversold areas
Three parameter RSI
You may also like
Indicator
Indices
RSI
ATR
+3
Divergency 1.1_withSourceCode
🔍 Divergency Indicator for cTrader (Update v1.1)
MultiTimeFrame Moving Averages
3 moving averages with different periods and different time frames.
CandleColourFlow_Limited_EURUSD
CandleColourFlow – smart color-coded trend indicator.
Indicator
RSI
Breakout
XAUUSD
+5
Prediction Based on Linreg & ATR
📊Predicts price movement by combining multi-timeframe trend analysis, market volatility 📉, and..
Multi Volume Profile
Advanced customizable volume-profile indicator with buy/sell levels, delta analysis, multi-TF support and vivid gradient
KANDIKA HEAT MAP
Color-Based Market Pressure & Volatility Visualizer The Kandika Heatmap Indicator
DMI CUSTOM SESSIONS
This will allow you to have SESSIONS on the chart. London, New York, Asian session and you can customize the times.
Indicator
NAS100
NZDUSD
Breakout
+12
RT ATR Bands
Enhance trading with ATR Bands! Visualize market volatility using dynamic upper and lower ATR bands for precise decision
JMA-Like
JMA-like is a highly responsive and ultra-smooth moving average designed to replicate the behavior of the original JMA!
Indicator
RSI
Breakout
XAUUSD
+4
ZScore Reversion
Z-Score: Measures price deviations from its mean. Spots overbought/sold (±2-3 SD) & reversals. Key for stats trading
Indicator
RSI
Breakout
Supertrend
Leverage Liquidation Map
📊 Liquidation Map: Potential areas where highly leveraged investors might face liquidations.
Indicator
Indices
Forex
EURUSD
+2
US Dollar Index
US Dollar Index
Indicator
Indices
XAUUSD
Stocks
+5
cAlgoBuddy - Ultimate Candlestick Patterns
The ultimate candlestick suite is here to help you detect most of the candlestick patters that exist today.
Indicator
Indices
XAUUSD
Commodities
+8
ATR on Chart
Plots the ATR on the chart for easy visualization.
Indicator
Signal
MeetAlgo_ChannelTrading_cTrader
Channel Trading is a volatility-based indicator using envelope theory to spot price breakouts and trade signals.
Indicator
Indices
Commodities
Forex
Smart Floating Risk - Premium version
The Floating Risk Indicator is an essential tool for traders who prioritize risk management.
[Hamster-Coder] Pivot Points (Demo)
[Hamster-Coder] Pivot Points (Demo)
Indicator
NAS100
NZDUSD
XAUUSD
+11
RT VWAP
Unlock VWAP in cTrader! Choose anchor periods, price sources, and display deviation bands with real-time tick updates.