Indicator
NAS100
NZDUSD
XAUUSD
Commodities
Forex
EURUSD
GBPUSD
BTCUSD
Indices
Prop
Stocks
Crypto
USDJPY
RT Time Segmented Volume
"RT Time Segmented Volume" logo
25/09/2025
Desktop
Since 25/09/2024
Sales
20
"RT Time Segmented Volume" uploaded image"RT Time Segmented Volume" uploaded image

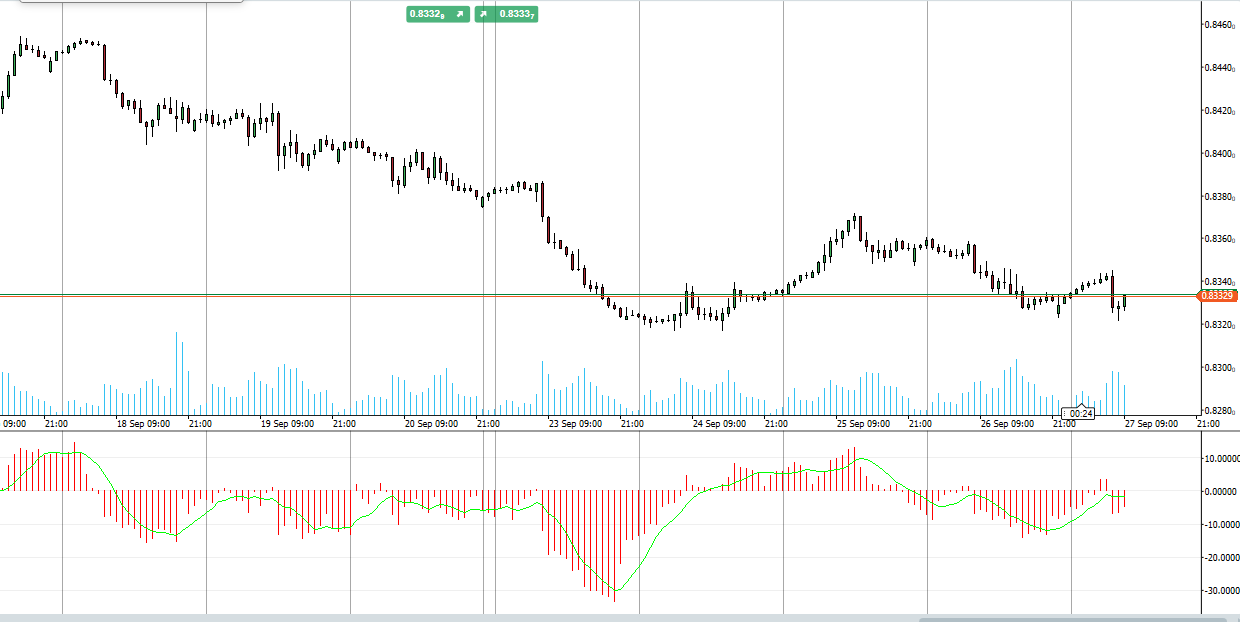
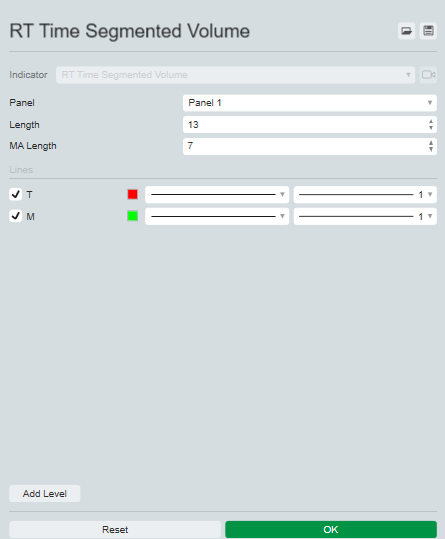
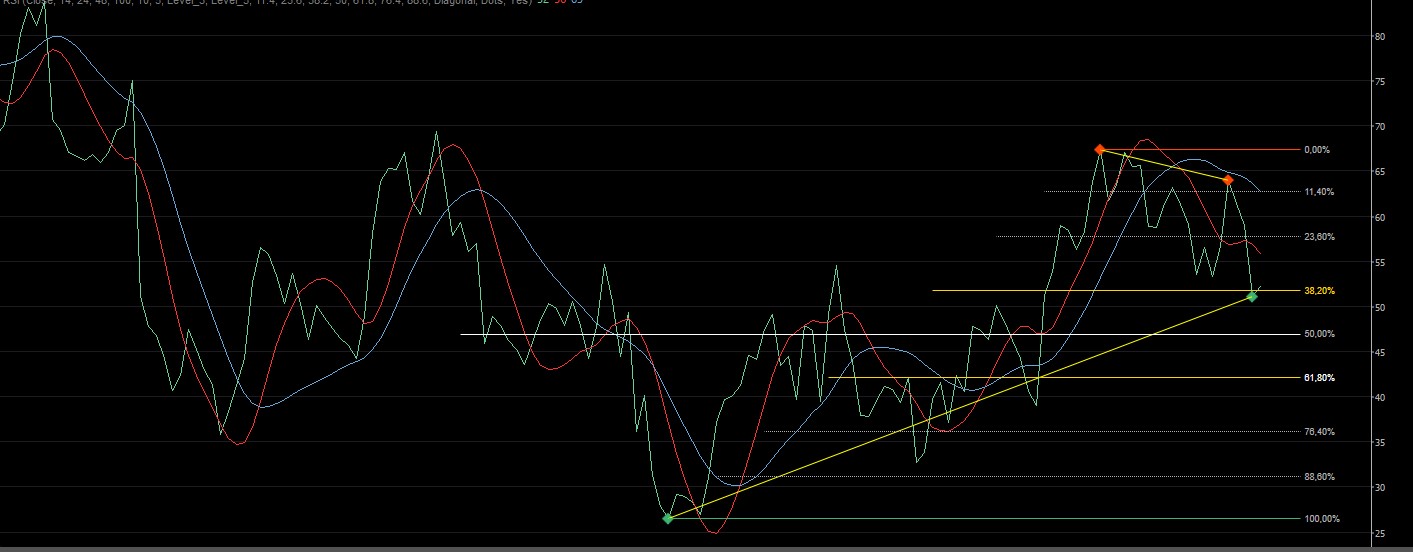
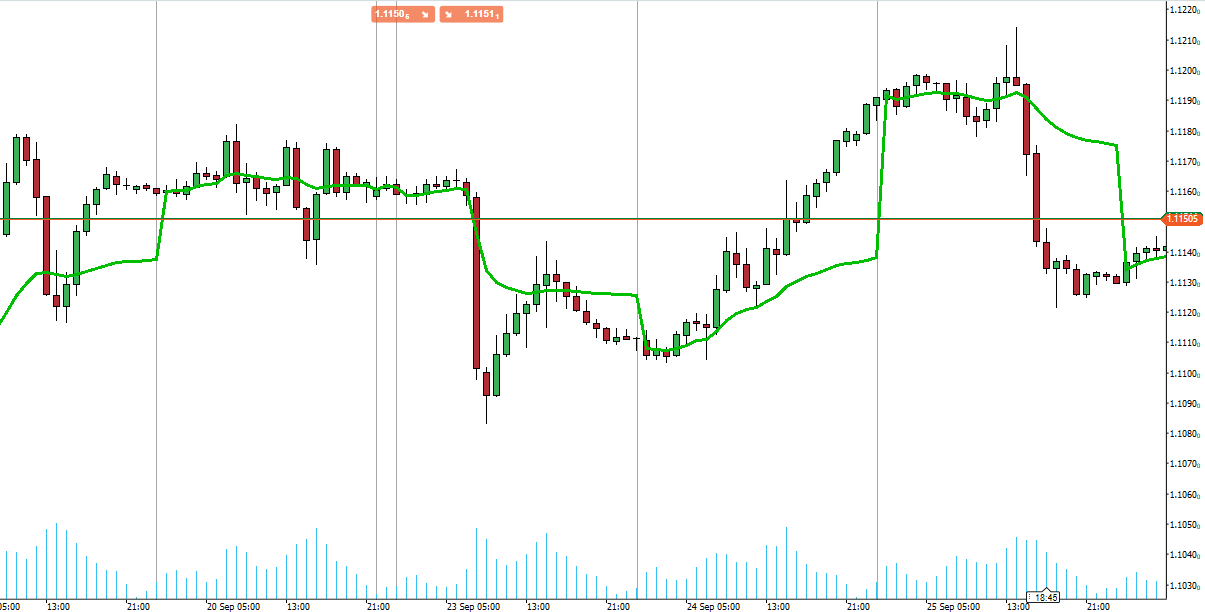
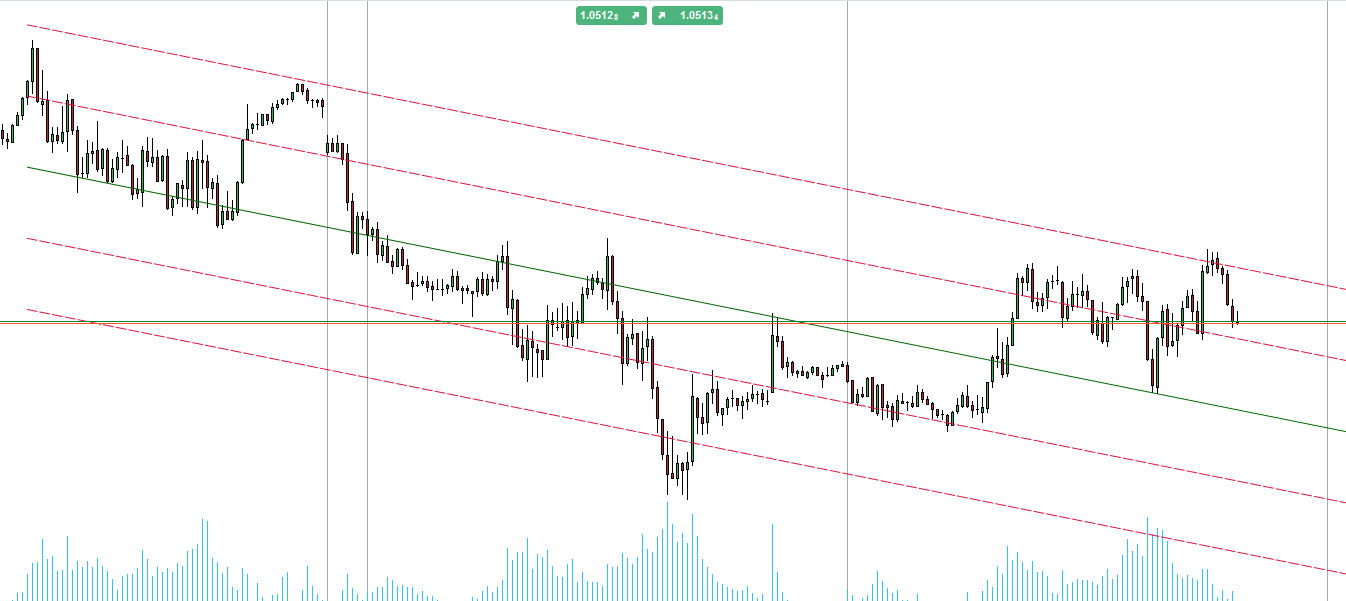
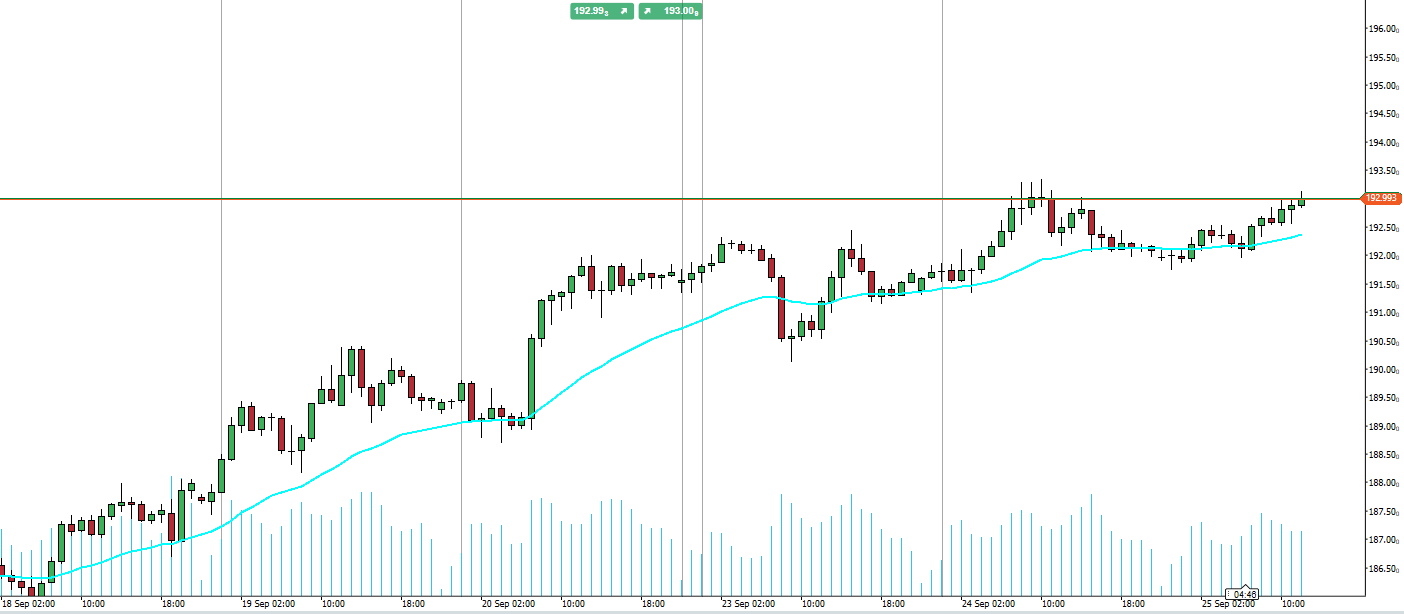
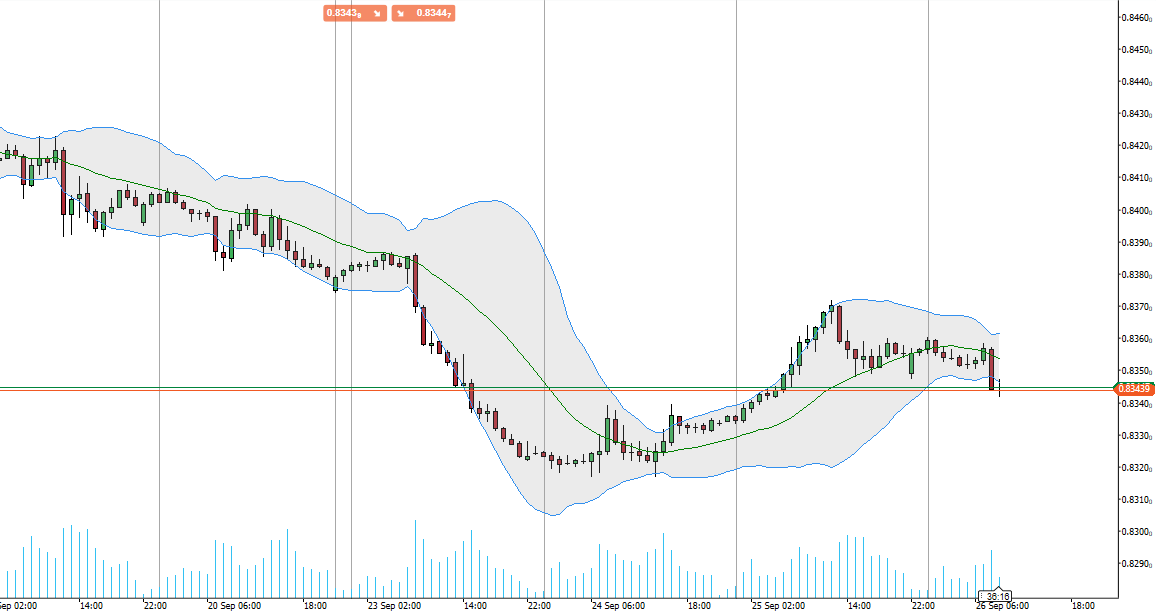
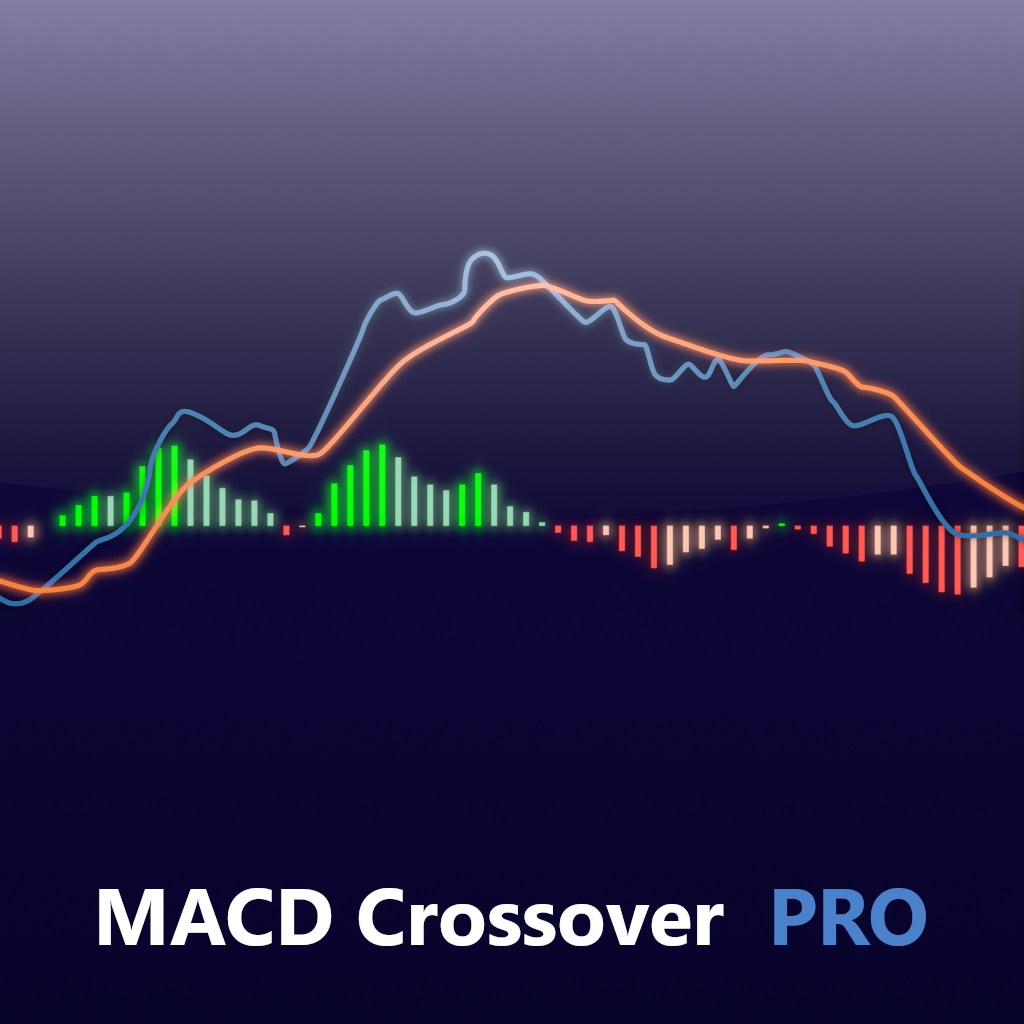
Introducing the Time Segmented Volume (TSV) indicator, designed to enhance your trading strategy with deeper insights into volume flow and price trends.

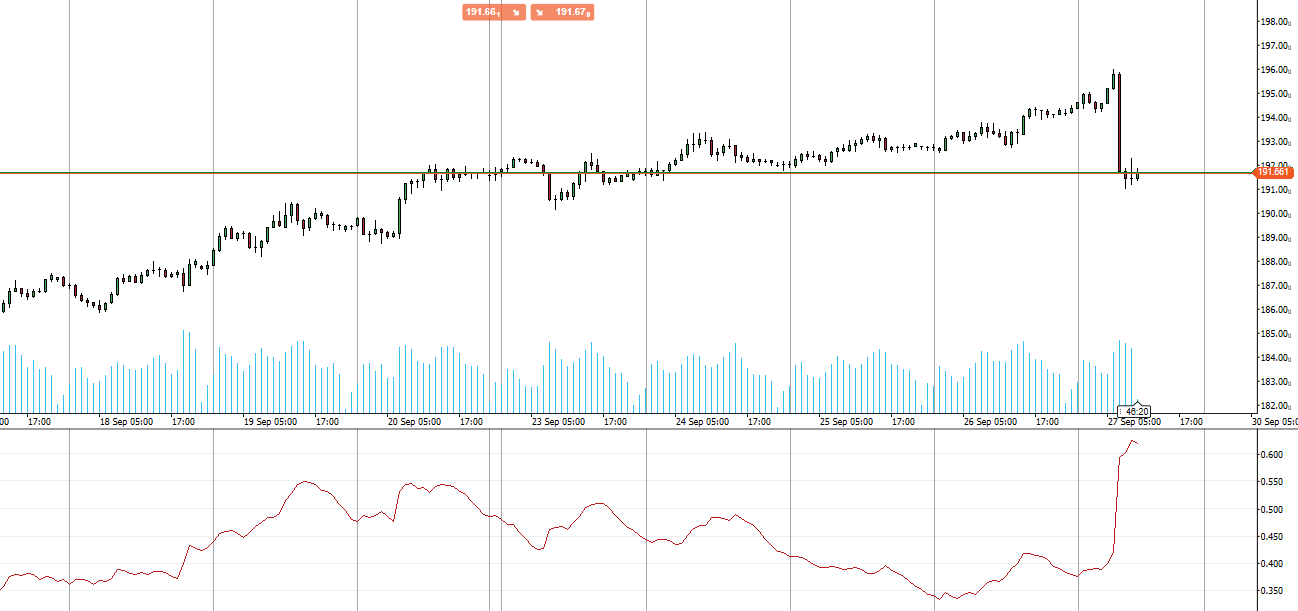
The TSV indicator measures the relationship between price and volume over a specified time period, helping you identify accumulation and distribution phases in the market.

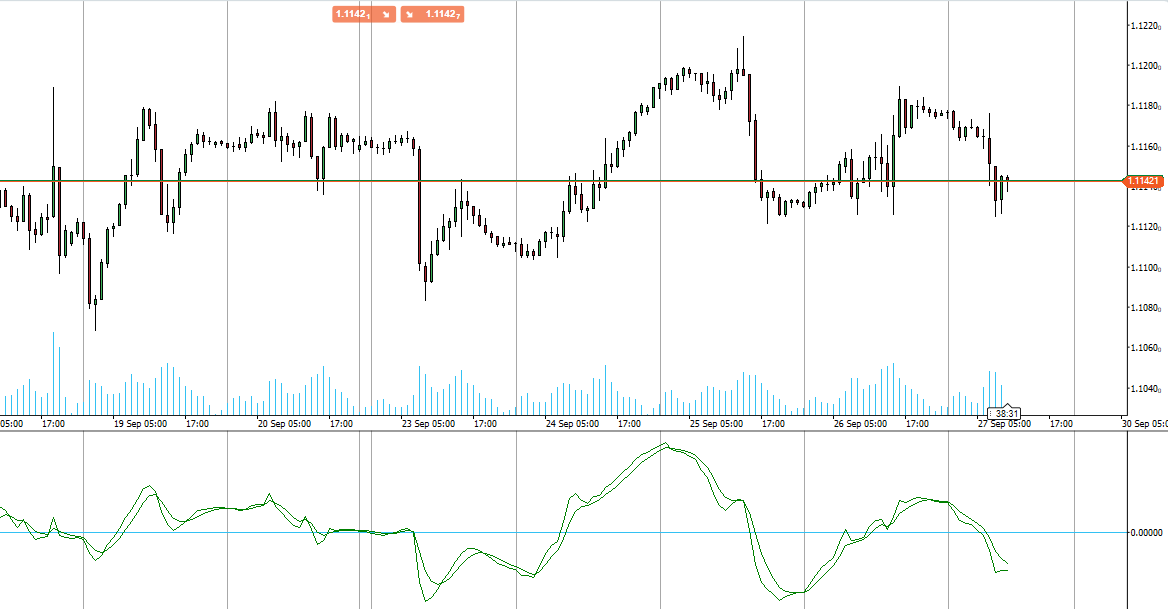
Identify used to identify trends in stock prices, pinpoint support and resistance levels, and decode trading signals.

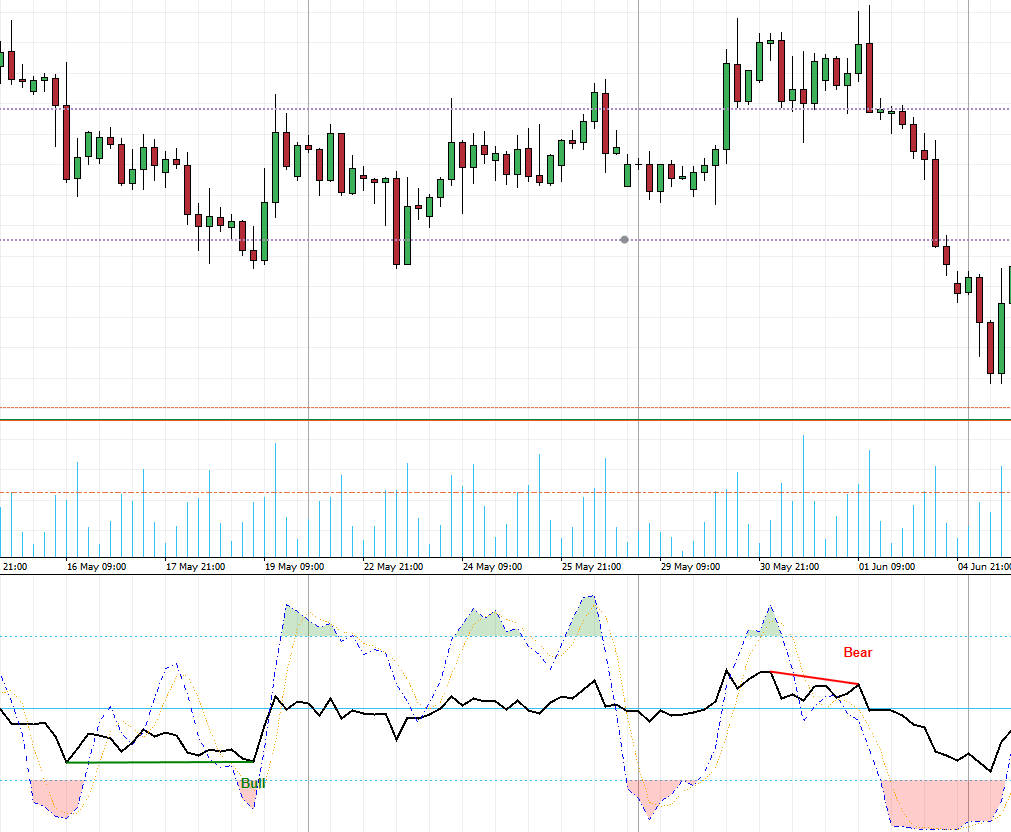
Perfect for traders seeking to refine their analysis and improve their decision-making, the TSV indicator offers a powerful tool for understanding market dynamics.

Upgrade your trading toolkit with the Time Segmented Volume indicator for superior trading performance.

More from this author
Indicator
NAS100
NZDUSD
XAUUSD
+11
RT VWAP
Unlock VWAP in cTrader! Choose anchor periods, price sources, and display deviation bands with real-time tick updates.
RT TradingView ATR
Upgrade to ATR-RMA! Experience the precise ATR using Relative Moving Average for accurate volatility analysis in cTrader
Indicator
NAS100
Indices
NZDUSD
+9
RT True Strength Index
Enhance trading with TSI! Use the True Strength Index for clear insights into market momentum and trend strength.
Indicator
Indices
RSI
XAUUSD
+9
RT Stochastic RSI PRO
Unlock Stochastic RSI PRO in cTrader! Overlay RSI, highlight zones, and identify divergences with customizable settings.
Indicator
NAS100
NZDUSD
XAUUSD
+10
RT Standard Deviation Channel_noSourceCode
Visualize trends with Standard Deviation Channel! Display median, and add customizable upper/lower deviation channels.
Indicator
NAS100
Indices
NZDUSD
+9
RT Relative Moving Average
Bring the RMA to cTrader! This is the Relative Moving Average from TradingView.
Indicator
NAS100
NZDUSD
XAUUSD
+12
RT Bollinger Bands Cloud
Visualize Bollinger Bands with a colored cloud for clarity. Enhance your trading precision with this dynamic indicator!
You may also like
Indicator
Signal
FAMA-MAMA
The FAMA-MAMA Indicator is a powerful, adaptive trend-following tool designed for professional and algorithmic traders.
MA Sabres
Conquer the markets with MA Sabres! This indicator spots trend flips with MAs and cool Sabre shapes & alerts.
Indicator
NAS100
NZDUSD
XAUUSD
+13
MACD Crossover PRO
Customize the MACD! Choose colors, get real-time tick updates, and see crossover points for enhanced trading precision.
Indicator
Forex
EURUSD
EconomicForex
ECONOMIC FOREX:provides insights into inflation, nominal interest rates and real interest rates, in the line chart
True Deviation System
True Deviation System – Precision Meets Professional Trading
Indicator
Signal
MACD
USDJPY
PulseTracker
Version 1.2: Advanced Trend Detection & Visualization System
AlphaTrend Pro by LudwigICT
Indicator
Bollinger
Repiptor BB Colored Width
Colored Bollinger Bands Width
SupertrendHTF
Overlay higher-timeframe SuperTrend to filter noise, follow real trends, and avoid lower-timeframe whipsaws. As
Indicator
NAS100
NZDUSD
Breakout
+12
ATR Bands
Enhance trading with ATR Bands! Visualize market volatility using dynamic upper and lower ATR bands for precise decision
Support Resistance Zones
Support and Resistance.
IR Candle MTF
with this indicator you could see other time frame candle in your chart.
Indicator
Indices
Stocks
Forex
+1
TwoSMA.cs
An indicator that accurately shows the trend direction. A vital tool for clear trading decisions.
Indicator
Grid
NAS100
NZDUSD
+15
TS_Pivot
Those who are involved in trading know how important it is to take into account the previous session. With Order Block
Indicator
RSI
Indices
Stocks
+3
FiboTrend-Pro V2
New version of one of my favorites includes Fibonacci and moving average convergence divergence lines
Top-rated
Free
FairValueGap
This Fair Value Gap (FVG) indicator is a technical analysis tool used to identify potential price imbalances.