LT Flexible Volume Profile
03/09/2025
2
Desktop
Since 25/09/2024
Sales
11
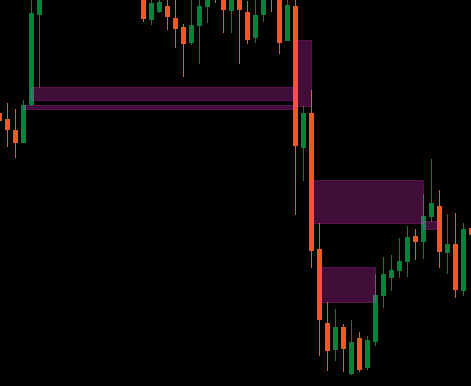
Volume Profile
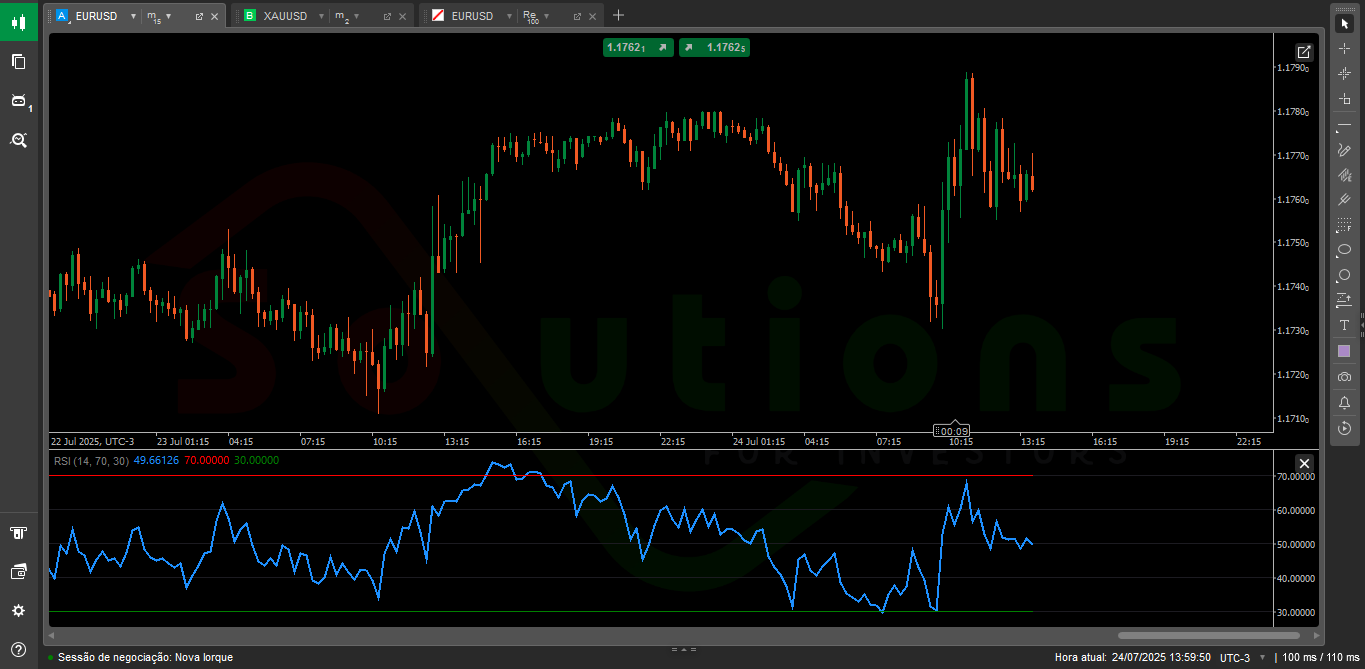
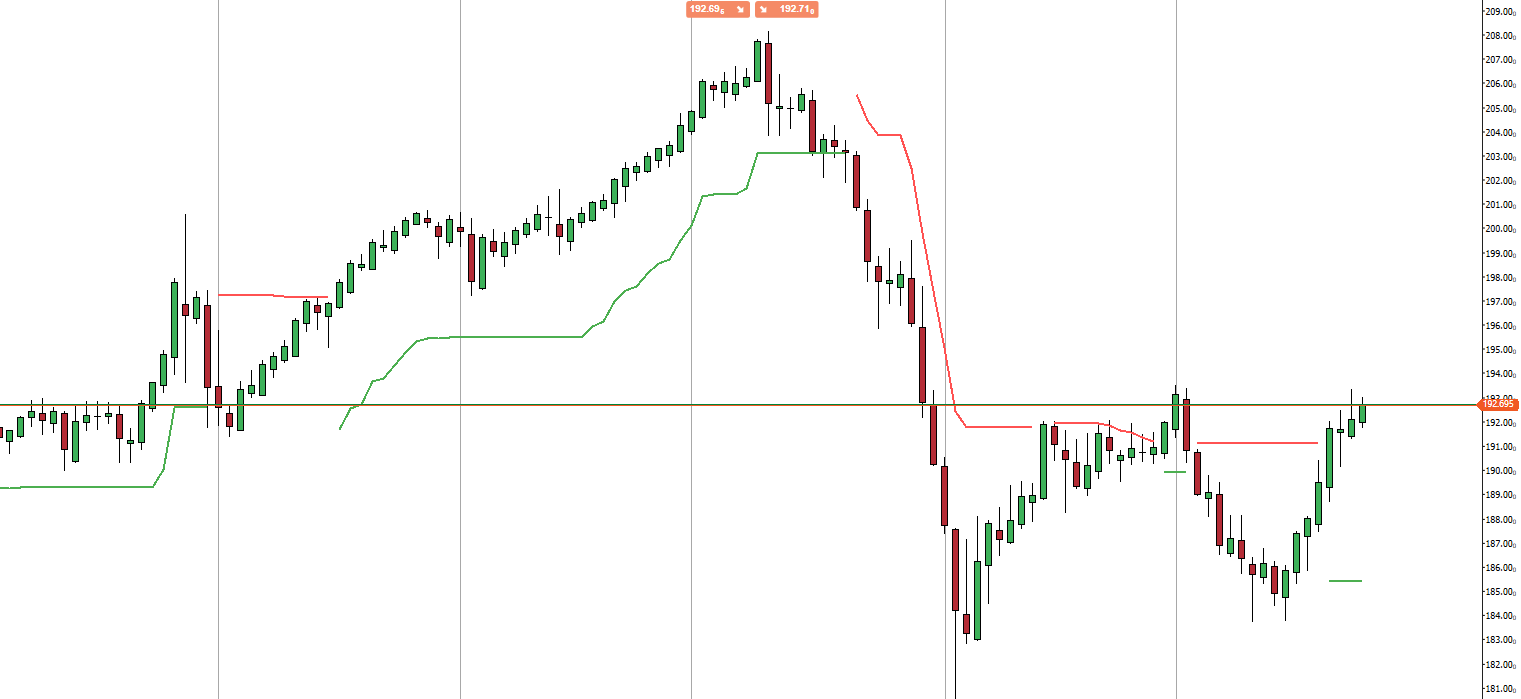
A vertical profile drawing in the price chart to show at which price there are more/less volume (trading interest).
The Flexible Volume Profile indicator
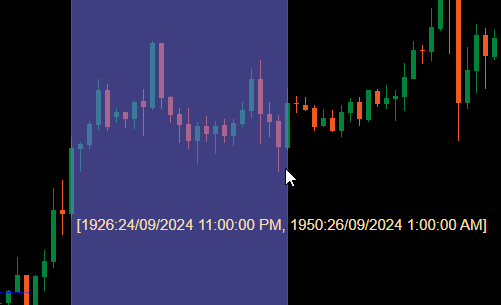
When added to your chart, Ctrl drag the left mouse on an area in the price chart to have profile drawn for that area.
For performance sake, the profile will be drawn in 2 states:
- Coarse profile: The indicator will use the timeframe defined by CoarseTF (default m5) to load for volume information, this usually fast. While Coarse profile is shown, the Fine profile will be loaded under ground.
- Fine profile: More precise profile, which use the timeframe defined by FineTF (default m1), but you can have it set to finest (t1 - single tick). However, if you are viewing Daily or longer TimeFrame chart, setting to ticks timeframe will increase the loading time.
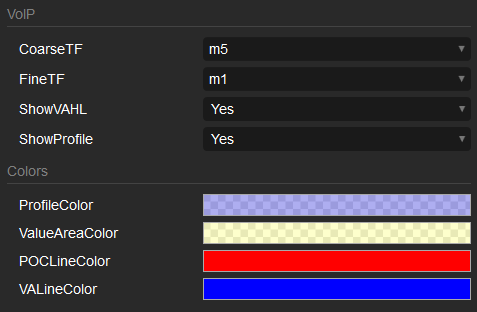
Parameters
- CoarseTF: Timeframe for Coarse data (default m5).
- FineTF: Timeframe for Fine data (default m1).
- ShowVAHL: Shows the VAH (Value Area High) and VAL (Value Area Low).
- ShowProfile: If Yes then showing the full profile, otherwise just show VAH, VAL and POC (Point of Control).
- Colors: Color customization.
How to use
After adding the indicator to your price chart, use a Ctrl left mouse drag to select the region in the chart that you would like to profile and that's it.
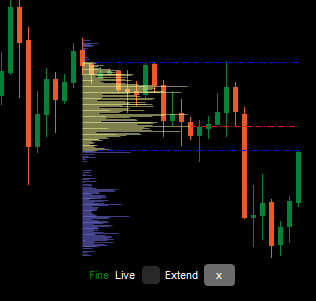
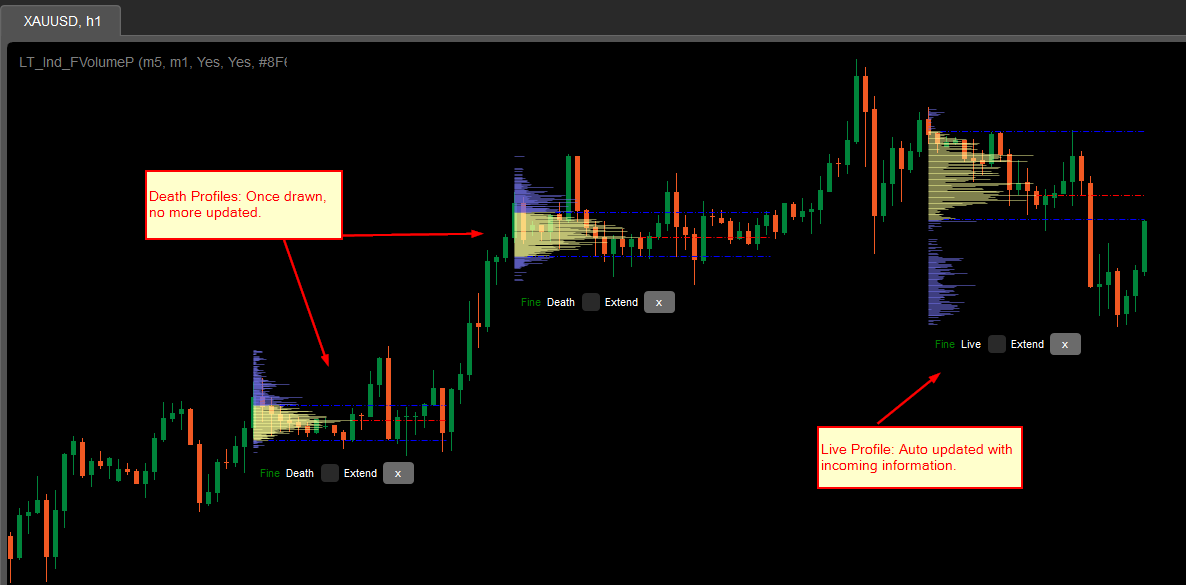
After the profile is rendered, you will see some information/manipulation at the bottom of the profile:
- Coarse/Fine: status of the profile.
- Death/Live: if your profile covers the latest bar (candle), then it is a Live profile and automatically updated with incoming information.
- Extend checkbox: check to have VAH, VAL and POC lines extend to the latest bar (candle)
- x button: Click to remove the profile from the chart.
More from this author
You may also like


.jpg)