说明
专业基于区间的成交量分析与智能蜡烛差量计算
释放精准成交量分析的力量,使用 区间差量蜡烛成交量分布,这是cTrader终极的基于区间的成交量分布指标。专为需要在自定义时间区间内进行灵活、准确成交量分析的交易者设计,该指标通过智能的基于蜡烛的差量计算,提供机构级的洞察。
🎯 主要特点
🏓 灵活的区间锚定
- 使用趋势线定义任意自定义时间区间
- 在您选择的点之间动态生成分布
- 随着市场发展实时更新
- 左侧或右侧锚定选项
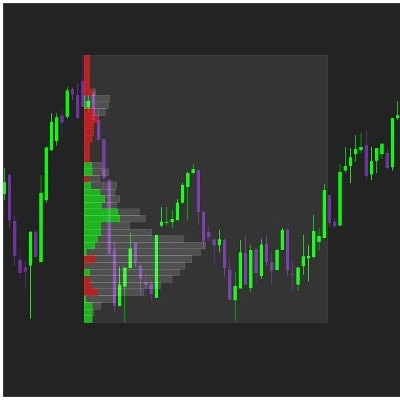
📊 智能基于蜡烛的差量分析
- 基于蜡烛方向的高级差量计算
- 绿色蜡烛 = 买入成交量 | 红色蜡烛 = 卖出成交量
- 每个价格水平的清晰单色可视化
- 即时识别积累/分布区
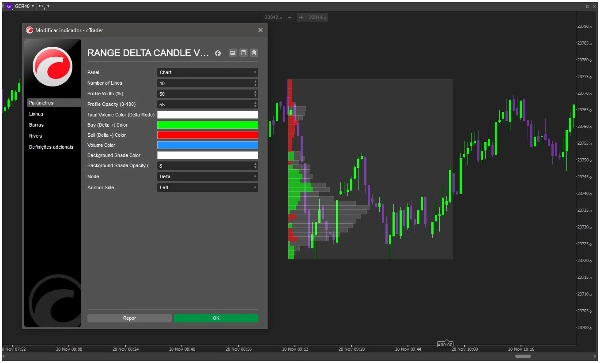
🎨 完全可定制的显示
- 可调节的箱数/线数(5-100)
- 可定制的分布宽度(区间的5-300%)
- 买入/卖出/总成交量的完整颜色控制
- 透明度和不透明度设置
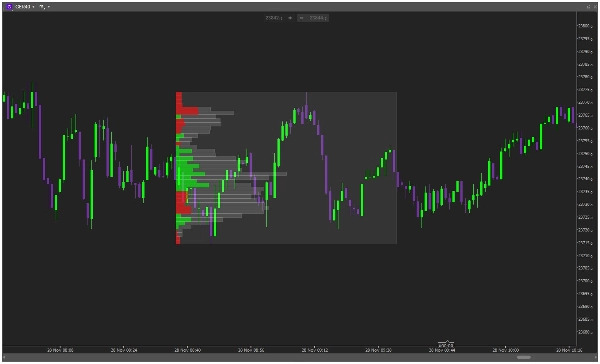
⚡ 双重显示模式
- 差量模式:可视化净买入/卖出压力
- 成交量模式:传统的成交量分布显示
- 选择左侧或右侧锚定
🚀 交易者为何选择它
“分析任何自定义区间的灵活性改变了游戏规则。非常适合会话分析和关键市场动向。” - 专业日内交易员
“终于有了一个真正有意义的区间成交量分布。基于蜡烛的差量计算极其准确。” - 波段交易员
📈 适用场景
- 会话分析 - 分析特定交易时段(伦敦、纽约、亚洲)
- 基于事件的交易 - 研究新闻事件和经济数据周围的成交量
- 技术分析 - 通过成交量验证确认支撑/阻力
- 市场结构 - 识别价值区和成交量缺口
🛠 简单易用
- 绘制 一条连接起点和终点的趋势线
- 观察 成交量分布自动生成
- 分析 自定义区间内的差量分布
- 交易 基于成交量确认的水平和洞察
🔧 技术规格
- 实时计算和更新
- 低资源消耗
- 兼容所有时间框架
- 适用于所有交易工具
📋 自定义选项
- 箱数/线数
- 分布宽度百分比
- 不透明度控制(0-100%)
- 自定义配色方案
- 锚定侧选择(左/右)
- 显示模式(差量/成交量)
🎯 今天就提升您的市场分析水平!
加入全球专业交易者的行列,他们已经通过 区间差量蜡烛成交量分布彻底改变了他们的市场分析。停止使用僵硬的固定区间工具,开始在您需要的地方精确分析成交量。
⭐ “能够分析自定义区间并进行准确的差量计算,彻底改变了我对市场结构的看法。必备工具!”
立即将区间差量蜡烛成交量分布添加到您的cTrader平台,掌握任何市场条件下的成交量分析!
🆚 为什么选择它而非其他成交量分布?
- ✅ 真正的灵活性 - 分析任意自定义时间区间
- ✅ 准确的差量 - 基于蜡烛的计算,结果可靠
- ✅ 专业可视化 - 清晰、机构级显示
- ✅ 真正的定制化 - 完全控制所有视觉元素
- ✅ 经过验证的方法论 - 基于专业交易原则
用灵活的基于区间的成交量分布分析力量,改变您的图表分析!
摘要
指标配置
客户评价
0.0
评价:0
客户评价
该产品尚无评价。已经试过了?抢先告诉其他人!
讨论
常见问答
BTCUSD
Forex
Indices
EURUSD
Commodities
GBPUSD
NZDUSD
Prop
Scalping
Fair Value Gap
SMC
Crypto
Stocks
XAUUSD
NAS100
USDJPY
VWAP
cTrader Store 提供的所有产品,包括交易机器人、指标和插件,均由第三方开发者提供,仅供信息参考和技术访问之用。cTrader Store 并非经纪商,不提供投资建议、个人推荐或任何未来业绩保证。
该作者的其他作品


猜您喜欢


价格
注册日期 14/02/2025
10
销售