
Trading product for Multi-Chart Sync Pro Indicador Supply & Demand Support & Resistance, image 1
Indicador
Versión 1.1, Jun 2026
Windows, Mac
Trading product for Multi-Chart Sync Pro Indicador Supply & Demand Support & Resistance, image 2
Trading product for Multi-Chart Sync Pro Indicador Supply & Demand Support & Resistance, image 3
Desde 11/03/2026

Descripción

Multi-Chart Sync Pro helps you manage many charts easily at the same time. You do not need to scroll, zoom, or change timeframes on every single chart by hand.

Why Use This Tool?

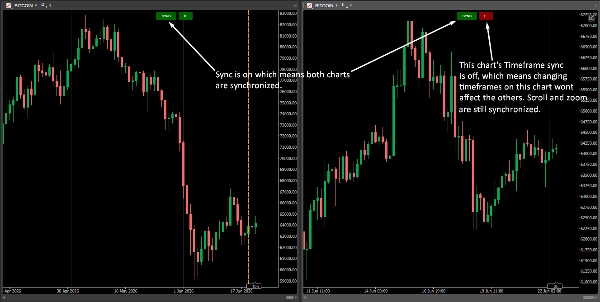
- Sync Scrolling: Scroll one chart, and all other charts move to the same time.

- Sync Zooming: Zoom in or out on one chart, and all other charts zoom to match.

- Timeframe Sync Toggle: Turn timeframe sync ON or OFF with one click. You can change one chart to a 5-minute view while your other charts stay on a 1-hour view.

- Easy Setup: Just click any chart to make it the main leader. No difficult setup needed.

How to Use It:

1. Download Multi-Chart Sync Pro.

2. Add the indicator to EVERY open chart on your screen.

3. "Sync" Button: Click to turn all sync features ON (Green) or OFF (Red).

4. "TF" Button: Click to turn timeframe sync ON or OFF independently.


Resumen

Perfil del indicador
Categoría del indicador
Soporte y resistencia
Tipo de resultado
Visualización
Requisitos de datos
Únicamente barras

Valoraciones de clientes

0.0
Valoraciones: 0
Valoraciones de clientes
Este producto todavía no se ha valorado. ¿Ya lo ha probado? Sea el primero en informar a otros.

Conversación

Preguntas frecuentes

Supply & Demand
Support & Resistance
Los productos disponibles a través de cTrader Store, incluidos bots, indicadores y plugins para operar, son proporcionados por desarrolladores de terceros y están disponibles únicamente con fines informativos y de acceso técnico. cTrader Store no es un bróker, por lo que no proporciona asesoramiento de inversión, recomendaciones personales ni ninguna garantía de rentabilidad futura.

Puede interesarle

Indicador
Prop
Forex
+13
Unlock trading precision with QQE! Dual QQE indicators with a Bollinger Bands zero line provide clear buy/sell signals.
Indicador
Forex
BTCUSD
+5
Buy-Side & Sell-Side Liquidity (BSL/SSL) Indicator
Indicador
Volume
Order Block
+4
Volume Profile with fixed period, custom range and buy/sell pressure.
Indicador
Prop
Forex
+13
Color Volume Bars – Visualize Market Strength Instantly
Indicador
ATR
RSI
+6
Market structural patterns , specifically the concepts of Change of Character (ChoCH) 🔄 and Break of Structure (BoS) 💥
Indicador
SMC
Prop
+17
Unlock the true intent of market participants with the Classic Proportional Cumulative Volume Delta CVD!
Indicador
SMC
BTCUSD
+9
Detects CHoCH breakouts, draws interest zones & auto Fibo. Built for Smart Money & Price Action Engulfing confirmation
Indicador
Drawdown Monitor
Proprietary trading desk risk monitoring dashboard!
Indicador
ATR
Flag
+5
Decision panel with Buy/Sell scores, market bias, setup quality, trading cost and clear trade reasons.
Indicador
Prop
Forex
+4
HMA MTF 2.0 (Multi-Timeframe )
Indicador
Forex
BTCUSD
+6
Multi-pole Gaussian filter channel with dynamic color, Reduced Lag & Fast Response modes. Port of DonovanWall's original
Indicador
Candle Timer & Strength Panel for cTrader Description: Candle Timer & Strength Panel is an advanced, always-visible over
Indicador
Liquidity Grab
Liquidity Sweep
+2
Visualizes accumulation ranges, manipulation sweeps and distribution phases on your cTrader chart.
Indicador
RSI
EURUSD
+2
It identifies areas of market imbalance (Fair Value Gaps or FVGs) and projects them on the chart in a smart way
Indicador
Auto-detect supply & demand zones, remove broken levels, and trade smarter with real-time alerts. Precision made simple.
Indicador
Key Levels
Market Structure
+1
HTF Candle Projector displays the current Higher Timeframe candle (4H or 1H) as a real projected candle LIVE..
Indicador
ATR
Engulfing
+3
Multi-timeframe Bias Alignment and Supply & Demand Zones Indicator.
Indicador
Prop
Forex
+10
Heatmap Pro analiza la volatilidad, el volumen y la acción del precio para "pintar" tu gráfico con zonas de color.

Precio

Desde 11/03/2026















