Descripción
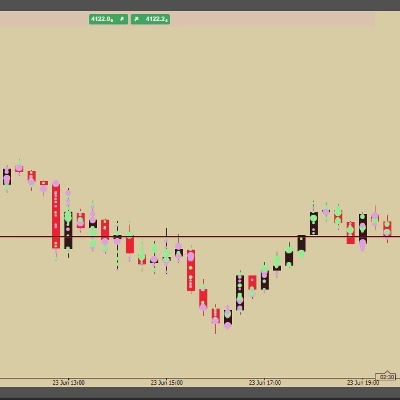
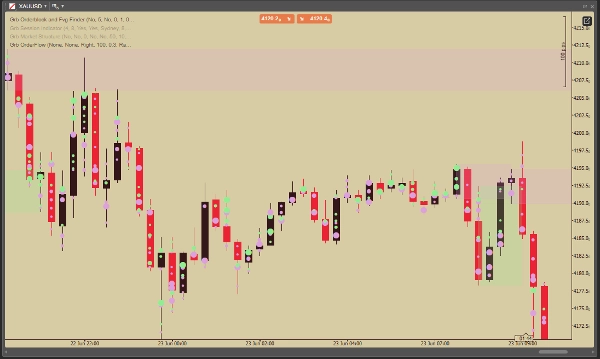
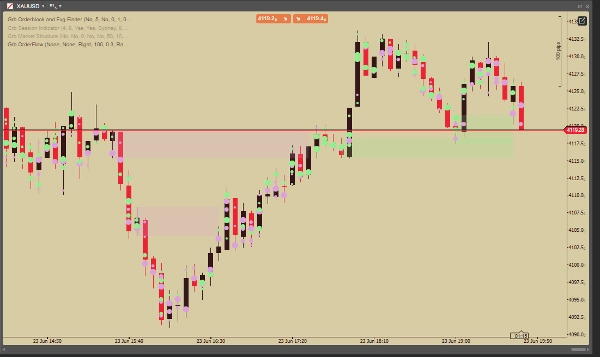
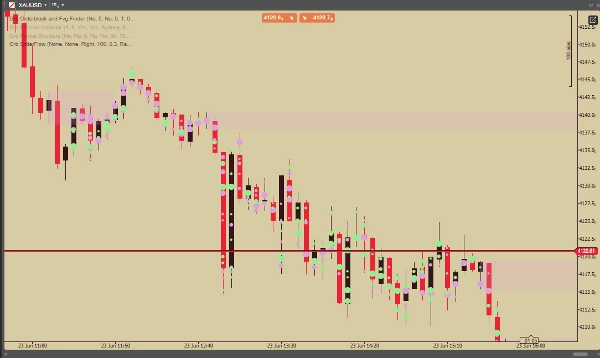
GRB Orderflow visualizes tick participation inside each candle to reveal aggressive buying and selling activity at each price level. Analyze raw participation, split buy/sell activity, delta imbalance, participation clusters, and candle summaries to better understand auction behavior and execution context.
Built for traders who want to inspect internal candle participation instead of relying only on price movement.
Features:
• Tick-level participation analysis per candle
• Raw Participation mode (total activity at each price level)
• Split Delta mode (separate buy/sell participation display)
• Net Delta summary visualization
• Total Participation summary mode
• Delta Percentage calculations
• Split Totals display (Buy vs Sell totals)
• Split Delta Percentage display
• Participation cluster detection engine
• Bubble visualization for dominant participation zones
• Dynamic bubble sizing based on activity strength
• Buy/Sell dominance coloring
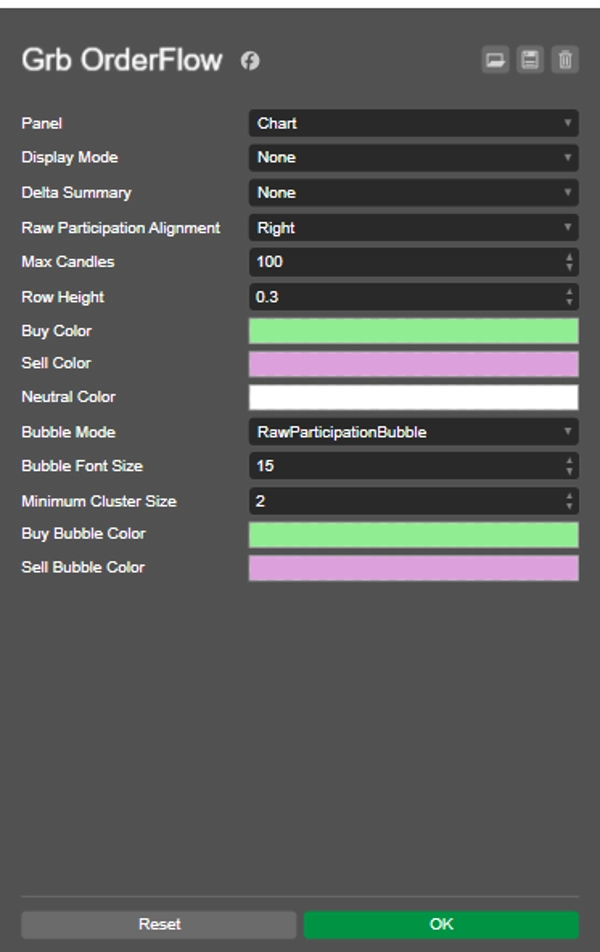
• Adjustable row segmentation (price resolution)
• Configurable text alignment
• Historical tick reconstruction
• Live candle updating
• Maximum visible candle control
• Cluster filtering with minimum cluster size
• Custom color system for buy, sell, neutral, and bubble states
• Lightweight chart overlay visualization
• Supports execution and auction context analysis