Mô tả
Sentinel Tick Volume Profile Free là một chỉ báo cTrader không giao dịch chuyển đổi dữ liệu tick-volume biểu đồ có sẵn thành một hồ sơ phân phối giá trực quan. Nó được thiết kế để giúp các nhà giao dịch thủ công hiểu được nơi hoạt động tick tập trung trong phạm vi biểu đồ đã chọn.
Chỉ báo hoạt động theo ba bước chính:
1. Chọn Phạm Vi Hồ Sơ
Chỉ báo đầu tiên quyết định các thanh nào nên được bao gồm trong tính toán hồ sơ.
Có hai chế độ phạm vi:
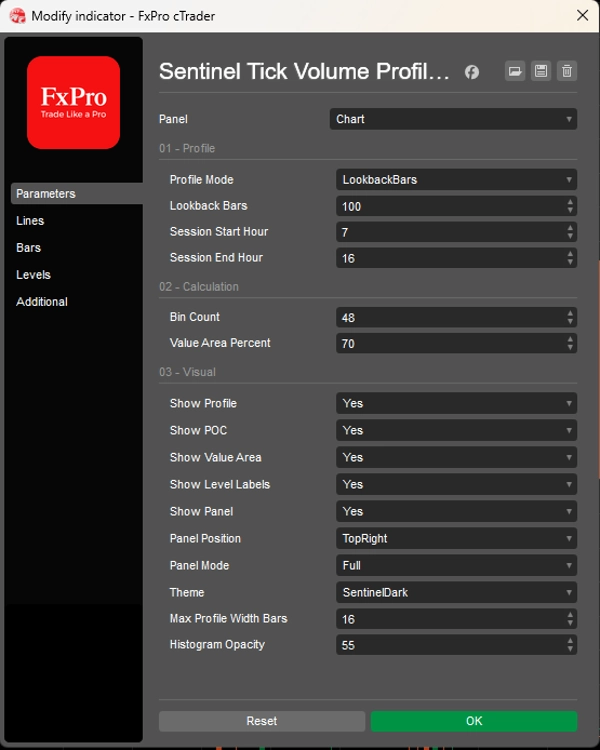
Lookback Bars
Sử dụng một số lượng cố định các thanh biểu đồ gần đây. Ví dụ, nếu Lookback Bars được đặt là 240, chỉ báo sẽ xây dựng hồ sơ từ 240 thanh gần đây nhất có trên biểu đồ.
Current Session
Sử dụng Giờ Bắt Đầu Phiên và Giờ Kết Thúc Phiên đã cấu hình. Giờ phiên được hiểu theo thời gian biểu đồ của chỉ báo. Chỉ báo có thể xử lý các phiên đang hoạt động, các phiên đã hoàn thành, các phiên trước đó và các phiên qua đêm.
Lựa chọn phạm vi này xác định khu vực giá và mẫu tick-volume được sử dụng cho hồ sơ.
2. Xây dựng Hồ Sơ Tick-Volume
Sau khi phạm vi được chọn, chỉ báo chia phạm vi giá từ cao đến thấp đã chọn thành một số lượng thùng giá có thể cấu hình.
Tick volume của nhà môi giới của mỗi thanh sau đó được phân bổ vào các thùng mà phạm vi cao-thấp của thanh đó chạm tới.
Điều này tạo ra một phân phối tick-volume ước tính theo mức giá.
Từ phân phối này, chỉ báo tính toán:
POC Ước Tính
Thùng giá có mật độ tick-volume nhà môi giới cao nhất.
VAH Ước Tính
Ranh giới trên của khu vực giá trị ước tính.
VAL Ước Tính
Ranh giới dưới của khu vực giá trị ước tính.
Khu Vực Giá Trị Ước Tính
Khu vực xung quanh POC ước tính chứa phần trăm tick volume tổng thể đã chọn. Cài đặt khu vực giá trị mặc định là 70%.
Các giá trị này là ước tính dựa trên dữ liệu tick-volume của nhà môi giới. Chúng không phải là mức khối lượng được báo cáo bởi sàn giao dịch.
3. Hiển Thị Hồ Sơ Trên Biểu Đồ
Chỉ báo sau đó hiển thị hồ sơ đã tính toán như bối cảnh biểu đồ trực quan.
Nó có thể hiển thị:
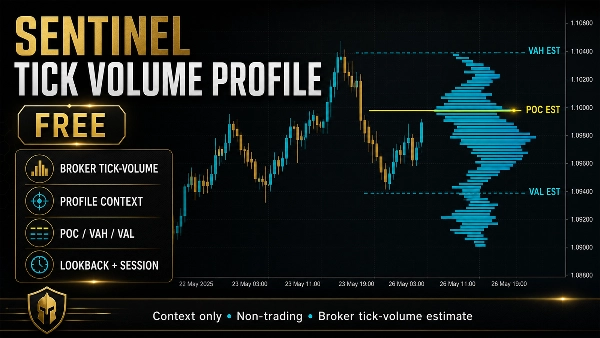
- Biểu đồ thanh tick-volume
- Đường POC ước tính
- Đường VAH ước tính
- Đường VAL ước tính
- Tô bóng khu vực giá trị
- Nhãn biểu đồ gọn: POC est, VAH est, và VAL est
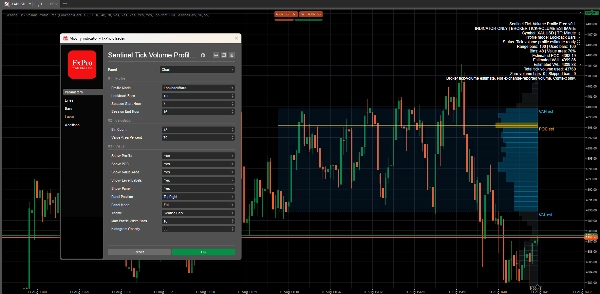
- Bảng tóm tắt với chế độ hồ sơ đã chọn, chi tiết phạm vi, số lượng thùng, các mức ước tính, tổng tick volume sử dụng, và lời giới hạn
Nhãn biểu đồ có thể được bật hoặc tắt. Hồ sơ, POC, khu vực giá trị và bảng cũng có thể được điều khiển riêng biệt.
CHẾ ĐỘ BẢNG
Chỉ báo bao gồm ba chế độ bảng:
Đầy Đủ
Hiển thị thông tin đầy đủ nhất, bao gồm các thanh phạm vi, thanh đã sử dụng, số lượng thùng, phần trăm khu vực giá trị, POC ước tính, VAH ước tính, VAL ước tính, tổng tick volume sử dụng, các thanh không có khối lượng, các thanh bị bỏ qua, và giới hạn tick-volume của nhà môi giới.
Gọn Gàng
Hiển thị tóm tắt ngắn hơn với chế độ, số lượng thùng, trạng thái, POC ước tính, và phạm vi khu vực giá trị.
Tối Thiểu
Hiển thị trạng thái rất gọn gàng một dòng tập trung vào POC ước tính và giới hạn chỉ bối cảnh.
Giới Hạn Dữ Liệu Quan Trọng
Sentinel Tick Volume Profile Free sử dụng dữ liệu tick-volume của nhà môi giới từ biểu đồ. Nó không sử dụng khối lượng được báo cáo bởi sàn giao dịch, khối lượng hợp đồng tương lai, dữ liệu footprint, delta, dữ liệu băng ghi, hoặc dữ liệu luồng lệnh tổ chức.
Do đó, hồ sơ được hiểu tốt nhất như một ước tính hồ sơ tick-volume của nhà môi giới.
Các giá trị có thể thay đổi tùy thuộc vào nhà môi giới, ký hiệu, khung thời gian, phiên, và lịch sử biểu đồ có sẵn.
Những Gì Chỉ Báo Không Làm
Sentinel Tick Volume Profile Free không đặt lệnh, không sửa đổi vị trí, không đóng giao dịch, không quản lý giao dịch, hoặc điều khiển cBots.
Nó không cung cấp tín hiệu mua, tín hiệu bán, xác nhận vào lệnh, hướng dẫn giao dịch, dự đoán thị trường, ước tính tỷ lệ thắng, dự báo hiệu suất, hoặc tuyên bố lợi nhuận.
Nó chỉ là một công cụ bối cảnh trực quan thủ công.
Tóm tắt
The indicator divides the high-to-low price range of the selected bars into configurable price bins, allocating tick volume across these bins to estimate volume distribution by price level. It calculates key estimated levels including the Point of Control (POC)—the price bin with the highest tick volume concentration—along with the Value Area High (VAH), Value Area Low (VAL), and the Value Area itself, which by default covers 70% of total tick volume.
The profile is displayed visually on the chart with options to show a histogram, estimated POC, VAH, VAL lines, value-area shading, and compact labels. A panel provides summary information in three modes (Full, Compact, Minimal) detailing profile parameters and volume data. The indicator uses broker tick-volume data only and does not execute trades or provide trading signals. It serves as a manual visual tool to enhance market context understanding.










![Logo "Session Volume Profile (SVP) [Iridio Capital]"](https://cdn.ctrader.com/image/webp/b058beb7-b143-45f3-87d0-8c524c00b203_61552)