Description
⚡ Kaufman Efficiency Ratio (KER) – Édition gratuite
Clarté de la tendance, quantifiée.
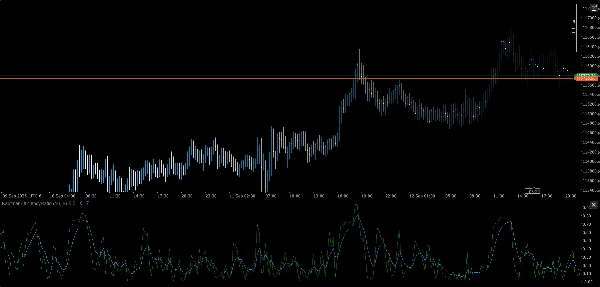
Le Kaufman Efficiency Ratio (KER) est un outil de précision pour mesurer l'efficacité du mouvement des prix du point A au point B—sans se perdre dans le bruit. Que vous validiez des conditions de rupture ou filtriez des mouvements latéraux, KER vous donne un score clair entre 0 et 1 qui reflète l'intention directionnelle par rapport à la volatilité.
🔍 Ce que ça fait
- Calcule le Kaufman Efficiency Ratio :
- Produit une valeur normalisée de 0 (bruit pur) à 1 (tendance parfaite)
- Met en évidence les régimes de tendance vs. non-tendance sans ambiguïté
- Idéal pour les superpositions adaptatives, les filtres de régime et le contrôle des signaux
🛠️ Fonctionnalités clés
- Gestionnaire d'entrée modulaire pour sourcing multi-échelles temporelles
- Compatible multi-actifs : FX, crypto, indices, actions
- Logique légère en temps réel sans retard de lissage
- Plug-and-play avec votre architecture de suite existante
🎯 Cas d'utilisation
- Validation de tendance : Confirmer le biais directionnel avant l'exécution du signal
- Filtrage du bruit : Supprimer les entrées pendant une action de prix inefficace
- Détection de régime : Associer avec des superpositions sensibles à la volatilité pour des transitions plus intelligentes
- Construction de stratégie : Utiliser comme métrique centrale dans la logique de rupture, momentum ou biais
💡 Bonus
KER est gratuit, rapide et impitoyablement efficace—tout comme votre code. Pas de fioritures, pas de filtres. Juste l'intention brute du marché, distillée.
Résumé
Profil de l'indicateur
Avis clients
0.0
Avis : 0
Avis clients
Il n'y a pas encore d'avis sur ce produit. Vous l'avez déjà essayé ? Soyez le premier à en parler aux autres !
Discussion
Questions fréquentes
Signal
Breakout
Les produits disponibles sur cTrader Store, notamment les bots de trading, les indicateurs et les plug-ins, sont fournis par des développeurs tiers et mis à disposition à titre informatif et à des fins d'accès technique uniquement. cTrader Store n'est pas un courtier et ne fournit aucun conseil en investissement, aucune recommandation personnelle ni aucune garantie quant aux performances futures.


Prix
26
Ventes
2.18K
Installations gratuites