
Description
Pinescritlabs
Indicateurs du Ctrader Store : 🤖cBots du Ctrader Store Pinescritlabs :
Fair Value Gap Sessions Gold & BTC Breakout Session Pivots(nouveau)
Dynamic Market Structure
Analyse des points de retournement
Fibonacci Linear
Régression multi-échelle
Multi-Level Candle Bias
Tracker
Auto Support and
Resistance Trend Lines
All Support and
Resistance Levels
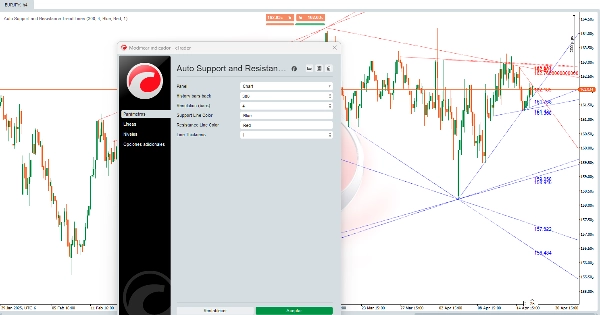
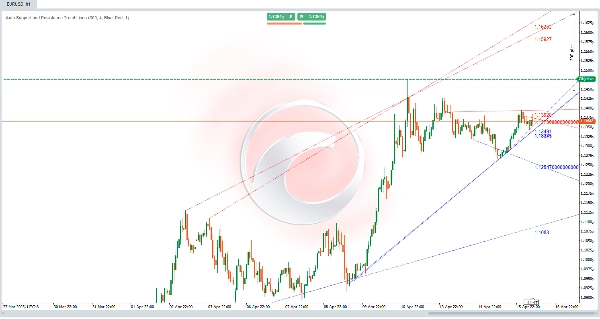
Lignes de tendance de support et de résistance automatiques :
Cet algorithme est un outil puissant 🛠️ conçu pour identifier automatiquement les niveaux de support et de résistance sur un graphique de prix. Il ne se contente pas de tracer des lignes horizontales, mais il trace également des canaux diagonaux ↗️↘️ qui représentent les tendances du marché. Ces niveaux et canaux sont des zones clés où le prix a eu du mal à monter (résistance 🚧) ou à descendre (support 🛡️), en faisant des points cruciaux pour les décisions de trading. 📈📉
Comment sont effectués les calculs ? 🔍
L'algorithme utilise une approche d'analyse de l'historique des prix 📊 pour identifier les niveaux de support et de résistance. Voici comment cela fonctionne :
- Identification des creux et sommets locaux ⬇️⬆️
-
- L'algorithme analyse le prix sur une plage spécifique de barres (bougies) pour trouver des creux locaux (les prix les plus bas dans cette plage) et des sommets locaux (les prix les plus hauts dans cette plage).
- Ces creux et sommets locaux sont des candidats potentiels pour devenir des niveaux de support et de résistance.
- Validation des niveaux ✔️
-
- Une fois les creux et sommets locaux identifiés, l'algorithme vérifie si ces niveaux ont été respectés par le prix dans le passé.
- Si le prix a touché un niveau plusieurs fois sans le franchir clairement, il est considéré comme un niveau valide de support ou de résistance.
- Tracé des lignes et des canaux ✏️
-
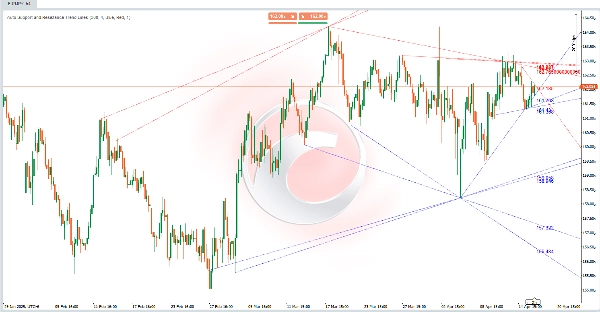
- Les niveaux de support sont tracés sous forme de lignes horizontales (ou diagonales) aux creux locaux validés.
- Les niveaux de résistance sont tracés sous forme de lignes horizontales (ou diagonales) aux sommets locaux validés.
- De plus, l'algorithme relie ces niveaux pour former des canaux diagonaux ↗️↘️, qui représentent des tendances haussières ou baissières sur le marché.
- Mises à jour dynamiques 🔄
-
- L'indicateur se met automatiquement à jour à chaque nouvelle barre, recalculant et retraçant les niveaux de support et de résistance en fonction du comportement récent des prix.
Comment cet algorithme aide-t-il les traders ? 💡
Cet algorithme est un changeur de jeu pour les traders parce que :
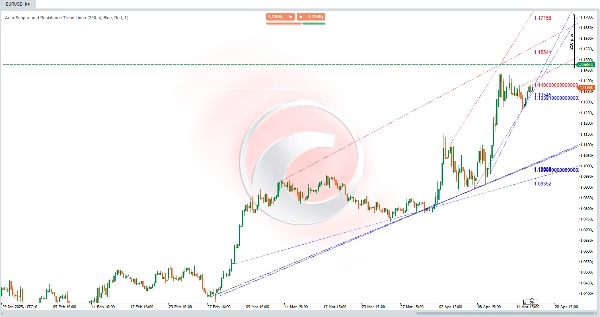
- Fournit une vue macro du marché 🌐
-
- En traçant des canaux diagonaux, l'algorithme montre les principales tendances du marché, aidant les traders à identifier si le prix est dans une tendance haussière 📈, baissière 📉, ou un mouvement latéral ↔️.
- Identifie les zones clés de support et de résistance 🎯
-
- Les niveaux de support et de résistance sont des zones où le prix peut rebondir ou casser. Ces niveaux sont utiles pour :
-
- Définir des points d'entrée et de sortie pour les trades.
- Placer des ordres de stop-loss 🛑 et de take-profit ✅.
- Identifier des ruptures 🚀 ou des renversements 🔄 du prix.
- Simplifie l'analyse technique 🕒
-
- L'algorithme automatise le processus d'identification des supports et résistances, économisant du temps aux traders qui effectuent une analyse manuelle.
- En affichant clairement les niveaux et les canaux, il aide les traders à prendre des décisions plus éclairées.
- Personnalisable 🎨
-
- Les traders peuvent ajuster des paramètres tels que le nombre de barres historiques analysées, épaisseur des lignes, et couleurs, permettant à l'indicateur d'être adapté à différents styles de trading et préférences visuelles.
Exemple pratique 📌
Imaginez que vous analysez un graphique de prix, et que l'algorithme a tracé :
- Une ligne de support diagonale ↗️ reliant plusieurs creux locaux, indiquant une tendance haussière.
- Une ligne de résistance diagonale ↗️ reliant plusieurs sommets locaux, montrant un canal ascendant.
- Plusieurs lignes horizontales représentant des niveaux clés de support et de résistance.
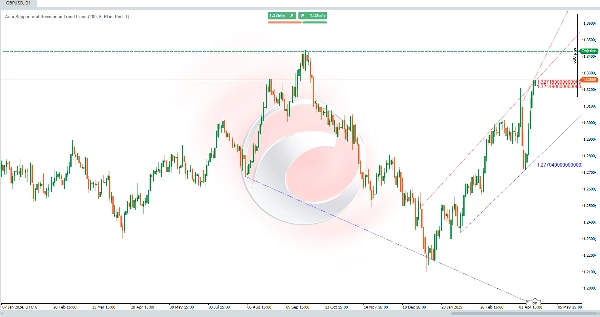
Avec ces informations, vous pouvez :
- Identifier que le prix est dans une tendance haussière 📈.
- Chercher des opportunités d'achat près de la ligne de support diagonale ou des niveaux de support horizontaux.
- Placer un stop-loss 🛑 en dessous du niveau de support le plus proche.
- Observer si le prix franchit la résistance pour confirmer la poursuite de la tendance ou un potentiel renversement 🔄.
Résumé
Once validated, support and resistance levels are drawn as horizontal or diagonal lines, and connected to form channels indicating bullish or bearish trends. The indicator updates dynamically with each new bar, recalculating and redrawing levels to reflect the most recent price behavior.
This tool aids traders by providing a macro view of market trends, identifying zones where price may bounce or break, and simplifying technical analysis through automation. It supports setting entry and exit points, stop-loss and take-profit orders, and spotting potential breakouts or reversals. Parameters such as the number of historical bars analyzed, line thickness, and colors can be customized to fit different trading styles and preferences.


