present
Inscrivez-vous et bénéficiez d'une remise de 50 $ sur votre premier achat
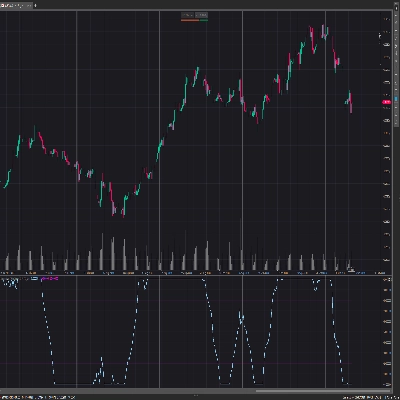
Trading product for Fisher Oscillator Indicateur EMA Market Structure, image 1
Fisher Oscillator
Indicateur
Version 1.0, May 2026
Windows, Mac
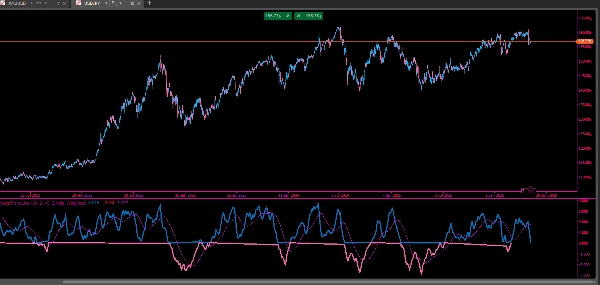
Trading product for Fisher Oscillator Indicateur EMA Market Structure, image 2
Depuis le 21/02/2025
466.3M
Volume tradé
180.83K
Pips gagnés
26
Ventes
7.44K
Installations gratuites

Description

Cet indicateur est une version modifiée de la transformation de Fisher conçue pour cTrader. Il convertit les données de prix en un oscillateur normalisé qui met en évidence les points de retournement potentiels sur le marché.

Il calcule une transformation de Fisher lissée basée sur le prix médian (moyenne du plus haut et du plus bas) sur une période configurable. La transformation met en avant les mouvements extrêmes des prix, facilitant l’identification des sommets et des creux.

Pour réduire le bruit, les valeurs brutes de Fisher sont ensuite lissées à l’aide de deux moyennes mobiles avec des périodes et types configurables. L’indicateur sépare également les valeurs positives et négatives de Fisher en deux tracés de couleurs différentes (vert et rouge), améliorant la clarté visuelle autour de la ligne zéro.

De plus, une ligne de signal (jaune) est tracée en utilisant la deuxième moyenne mobile, aidant les traders à identifier plus clairement la direction de la tendance et les changements de momentum.

Dans l’ensemble, cet indicateur est utilisé pour détecter les retournements, mettre en évidence les conditions de surachat/survente, et fournir une confirmation de tendance plus fluide grâce à une moyenne en couches.

Résumé

AI summary
The Fisher Oscillator is a modified version of the Fisher Transform indicator designed for the cTrader platform. It converts price data into a normalized oscillator that highlights potential market turning points by emphasizing extreme price movements. The calculation is based on a smoothed Fisher Transform of the midpoint price (average of high and low) over a configurable period.

To reduce noise, the indicator applies two moving averages with customizable periods and types to smooth the raw Fisher values. It visually separates positive and negative Fisher values into green and red plots, respectively, enhancing clarity around the zero line. Additionally, a yellow signal line derived from the second moving average helps identify trend direction and momentum shifts.

This indicator is primarily used to detect market reversals, highlight overbought and oversold conditions, and provide smoother trend confirmation through layered averaging. It supports trend and market structure analysis and outputs visual signals suitable for bar-based price data.

Profil de l'indicateur
Catégorie de l'indicateur
Tendance
Type de résultat
Visualisation
Exigences en matière de données
Barres seulement
Signaux pris en charge
Puissance de la tendance
Inversion

Avis clients

0.0
Avis : 0
Avis clients
Il n'y a pas encore d'avis sur ce produit. Vous l'avez déjà essayé ? Soyez le premier à en parler aux autres !

Discussion

Questions fréquentes

EMA
Market Structure
Moving Average
Les produits disponibles sur cTrader Store, notamment les bots de trading, les indicateurs et les plug-ins, sont fournis par des développeurs tiers et mis à disposition à titre informatif et à des fins d'accès technique uniquement. cTrader Store n'est pas un courtier et ne fournit aucun conseil en investissement, aucune recommandation personnelle ni aucune garantie quant aux performances futures.

Plus de cet auteur

Indicateur
RSI
Forex
+4
High-probability trading signals in the fast-paced world of forex and CFD trading.
Indicateur
Prop
Stocks
+4
High-Performance Renko Chart Indicator with Advanced filtering method - built for Renko and candlestick charts.
Indicateur
ATR
MSS
+5
Detects ICT Turtle Soup setups — liquidity sweeps with MSS confirmation, ATR filter & kill zone session filter.
Indicateur
SMC
Prop
+15
Automatic Elliott Wave Detection with Professional Filters
Indicateur
Fibonacci
Key Levels
DailyTargets: Dynamic ADR-based levels & targets. Includes Buy/Sell zones, previous Hi/Lo, and automated trend alerts.
Indicateur
EMA
RSI
+2
Advanced TDI indicator with Shark Fin signals, chart arrows, MTF RSI, divergence detection and smart alerts.
Indicateur
Key Levels
Order Block
+3
Marks NY session range, detects wick sweeps beyond box edges.. One signal per day. Overlay, no repainting!
Indicateur
MACD
Key Levels
+2
Trend indicator with multi-timeframe filters, generating signals only on fully completed bricks & candles. No Repaint.
Indicateur
Key Levels
Supertrend
+3
Marks London and New York session opening zones and alerts you instantly on breakouts.
cBot
EMA
SL Manager
+5
Fully automated dual-symbol hedging cBot for cTrader.
20.6%
ROI
8.66
Facteur de profit
Indicateur
BOS
Fair Value Gap
+1
ICT Quarterly Theory indicator — color-coded Q1–Q4 session zones with smart entry signals and real-time alerts.
cBot
RSI
Aggressive
automates entries based on the RSX indicator — a smoothed, low-lag variant of the classic RSI.
1.67
Facteur de profit

Vous pourriez aussi aimer

Indicateur
Track VWAP for Asia, London, NY, Sydney, Daily, Weekly, Monthly & Custom Sessions. Perfect for FX & intraday trading!
Indicateur
RSI
Laguerre RSI is based on John EHLERS' Laguerre Filter to avoid the noise of RSI.
Indicateur
Forex
Signal
+1
Innovative indicator that highlights trend direction and momentum strength quickly and clearly on Forex charts.
Indicateur
RSI
Breakout
+1
🚀 TrendHeikinMultiMA: Advanced trend detection using Heikin-Ashi smoothing & MAs! Eliminates noise, confirms real trend
Indicateur
MSS
Volume
+3
Rejection-based volume profile with tiered heat zones, POC levels and a fully draggable anchor on cTrader.
Logo de "ATR Bands"
Populaire
4.7
(4)
$19
Indicateur
ATR
Prop
+13
Enhance trading with ATR Bands! Visualize market volatility using dynamic upper and lower ATR bands for precise decision
Indicateur
Forex
Crypto
+6
The ultimate candlestick suite is here to help you detect most of the candlestick patters that exist today.
Indicateur
Risk Dashboard
AI-powered daily range forecasts help traders spot volatility opportunities and plan stops and targets.
Indicateur
Key Levels
Order Block
+5
Order blocks, fair value gaps, liquidity sweeps and a 24-timeframe signal scanner on one chart.
Indicateur
BOS
Volume
+5
The Volume Delta Indicator using Institutional Level 2 DOM Data, The Edge Institutions Pay Millions For, now on cTrader
Indicateur
AI
BOS
+4
Golden Boom and Crash Spike Detector is a trading tool designed for Crash 300 and Boom 300 indices on M1 Timeframe.
Indicateur
EMA
Volume
+4
Advanced volume‑profile tool with delta, HVN/LVN zones, and precise POC‑based trade signals.
Indicateur
Forex
EURUSD
+4
Check the correlations between dozens of assets in one elegant display.
Indicateur
Imbalance
Fair Value Gap
+1
Multi-symbol, multi-timeframe Fair Value Gaps in one panel.
Indicateur
AI
ATR
+25
On-chart draggable panel to show/hide Positions & Pending Orders with fixed warning banner and inline alerts per symbol.
Indicateur
ADX
ATR
+5
EMA-cross signals scored on six confluence layers, with an ATR stop, three targets and a live panel
Indicateur
SMC
Prop
+4
📈 Trading Sessions Indicator — London, New York & Tokyo Visualize Key Market Sessions + High/Low Levels with Precision
Indicateur
RSI
Forex
+6
What Constance Brown did with the RSI was to input a momentum calculation within the RSI itself. This the Composite RSI.

Prix

Depuis le 21/02/2025
466.3M
Volume tradé
180.83K
Pips gagnés
26
Ventes
7.44K
Installations gratuites