
Description
VWAP Ancré
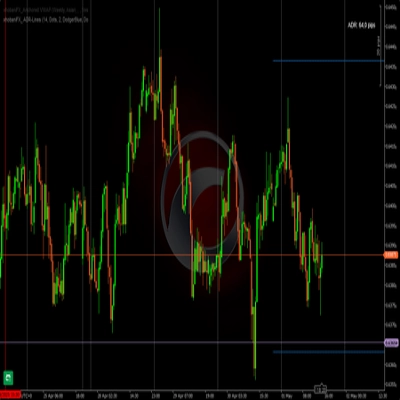
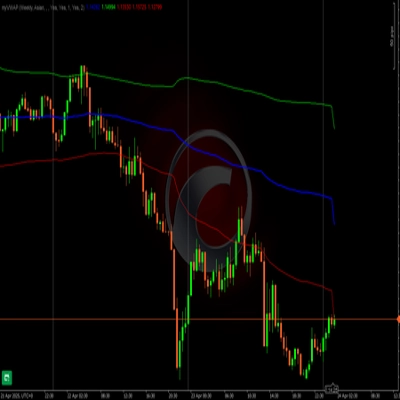
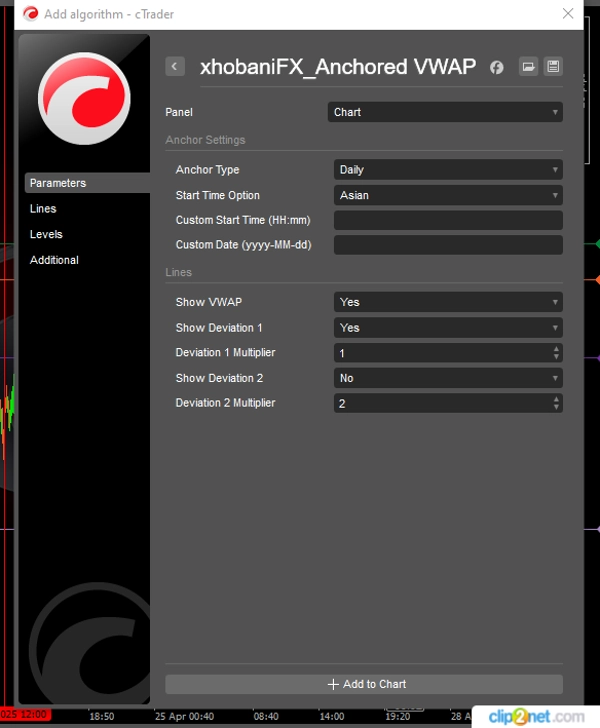
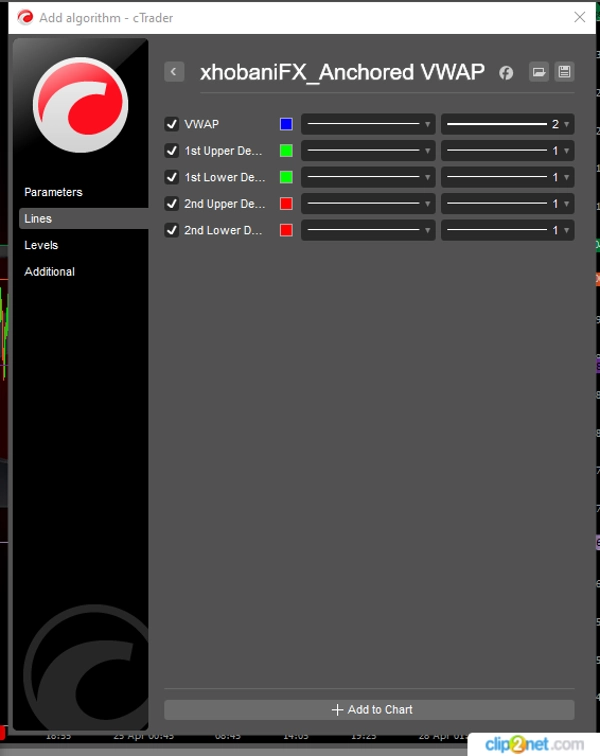
Ce VWAP est doté d'une fonctionnalité spéciale. Une fois que vous définissez la période d'ancrage, votre VWAP et les déviations préférées ne changent pas lorsque vous changez d'échelle de temps. J'utilise personnellement cet indicateur dans mon trading journalier et mon analyse. Le trader peut choisir parmi trois périodes d'ancrage, à savoir Quotidienne, Hebdomadaire et Mensuelle. Vous souhaitez utiliser un gap de marché, un sommet/creux comme ancre ? Je vous couvre. Vous pouvez également personnaliser votre point d'ancrage souhaité en saisissant la date et l'heure de début de l'ancre dans les paramètres de cet indicateur.
xhobani_FX privilégie la convivialité, l'optimisation et l'efficacité. Les défis du trading en conditions réelles ont été pris en compte et intégrés. Je continue de tester, mettre à jour et améliorer tous mes indicateurs. La satisfaction client est essentielle... ou peut-être devrais-je dire que la satisfaction du trader est essentielle. J'espère que cela vous satisfera et que vous reviendrez pour en avoir plus !
Bon trading !
Résumé
Avis clients
5 | 100 % | |
4 | 0 % | |
3 | 0 % | |
2 | 0 % | |
1 | 0 % |