EMA-Signal_BUY_SELL_V.2
Indikator
63 unduhan
Versi 1.0, Jun 2026
Windows, Mac
5.0
Ulasan: 1
Trading product for EMA-Signal_BUY_SELL_V.2 Indikator EMA, image 2
Trading product for EMA-Signal_BUY_SELL_V.2 Indikator EMA, image 3
Sejak 17/02/2025
63
Instal gratis

Deskripsi

[ Title ] EMA-Signal_BUY_SELL_V.2 (Dynamic Convergence & Breakout Notifier)

[ Description ] Indikator kustom kelas profesional yang dirancang untuk mendeteksi pergerakan harga eksplosif sebelum terjadi. Sempurna untuk trading harian dengan kecenderungan scalping pada aset yang sangat volatil seperti US500, US100, dan JP225.

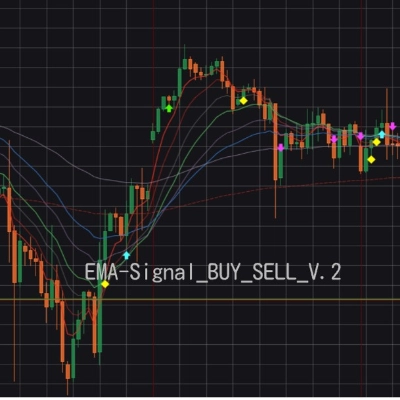
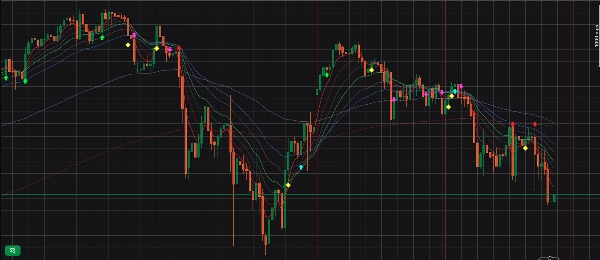
Indikator ini memantau 6 EMA (5, 9, 14, 19, 28, 38) untuk mengukur jarak di antara mereka secara dinamis. Ini memberi peringatan visual tentang fase pasar mulai dari "Konvergensi" (energi terkumpul) hingga "Breakout" (tren awal) dan "Perluasan Urutan Sempurna" (tren terkonfirmasi).

[ V.2 New Features ]

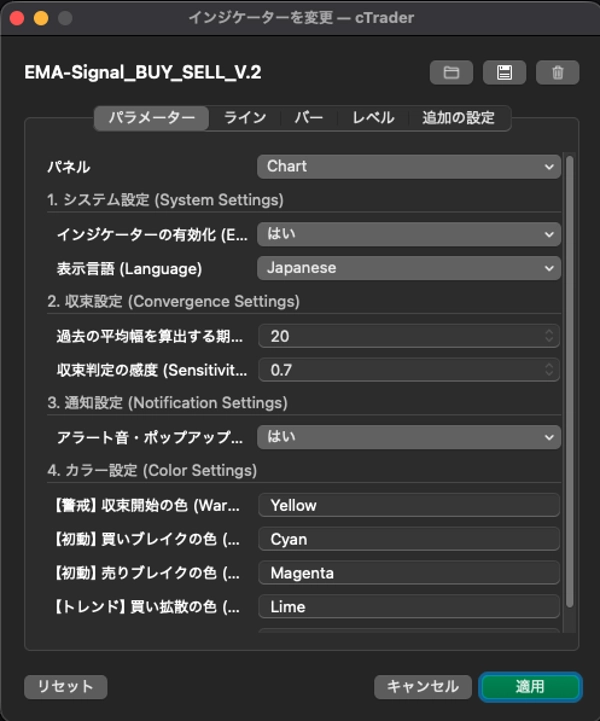
  • Dukungan Bilingual: Beralih antara UI parameter dan pesan peringatan dalam bahasa Inggris dan Jepang.
  • Warna yang Sepenuhnya Dapat Disesuaikan: Mudah mengubah warna semua tanda sinyal agar sesuai dengan tema grafik Anda.
  • Sakelar Jeda: Aktifkan/Nonaktifkan perhitungan indikator dan peringatan secara instan dari parameter.

[ Signals & Trading Tactics ] Saat peringatan aktif, periksa grafik dan lakukan perdagangan manual berdasarkan fase berikut:

1. ◆ Tanda Berlian (Peringatan: Konvergensi)

  • Arti: Energi pasar sedang mengompres (Pasar rentang).
  • Taktik: Jangan masuk. Ini adalah sinyal Anda untuk mempersiapkan dan memantau pergerakan eksplosif yang akan datang.

2. Panah Pertama (Gerakan Pertama: Breakout EMA 5)

  • Arti: EMA 5 terdekat telah sepenuhnya menembus kumpulan 5 EMA lainnya.
  • Taktik: Ini adalah tanda paling awal dari tren yang terbentuk setelah konvergensi. Ideal untuk entri awal yang agresif.

3. Panah Kedua (Tren: Perluasan Urutan Sempurna)

  • Arti: Semua EMA tersusun rapi dan mulai melebar.
  • Taktik: Tren telah sepenuhnya terkonfirmasi. Ini menawarkan probabilitas tertinggi dan titik masuk paling aman.

🔥 Pola Emas 🔥 Berlian (Pengisian Energi) > Panah Pertama (Break Awal) > Panah Kedua (Tren Terkonfirmasi). Ketika sinyal menyala dalam urutan ini, itu mewakili setup yang paling dinantikan dan sangat kuat.

[ Cara Pengaturan ]

  1. Terapkan "EMA-Signal_BUY_SELL_V.2" ke grafik Anda (misalnya, timeframe 15M).
  2. (Direkomendasikan) Tambahkan secara manual 6 EMA standar (5, 9, 14, 19, 28, 38) ke grafik Anda untuk konfirmasi visual sinyal yang jelas.

【 日本語 バージョン 】

[ タイトル ] EMA-Signal_BUY_SELL_V.2 (ダイナミック収束&ブレイクアウト通知)

[ 説明文 ] 爆発的なトレンドが発生する「初動」を的確に捉えるために開発された、プロ仕様のカスタムインジケーターです。US500、US100、JP225などのボラティリティが高い銘柄での、スキャルピング寄りのデイトレードに最適です。

6本のEMA(5, 9, 14, 19, 28, 38)の幅を監視し、相場のエネルギーが溜まる「収束」から、トレンドが発生する「初動ブレイク」、そして「パーフェクトオーダーの拡散」までを視覚的なマークとポップアップ・アラートでお知らせします。

[ V.2 の新機能 ]

  • 日英言語切り替え: パラメーター画面とアラート通知を「日本語 / English」で自由に切り替え可能。
  • カラーの完全カスタマイズ: 5種類のシグナルマークの色を、ご自身のチャート背景に合わせて自由に変更可能。
  • 一時停止スイッチ: チャートから削除することなく、パラメーターからワンタッチで計算と通知を一時停止可能。

[ シグナルの意味とトレード戦術 ] アラートが鳴ったらチャートを確認し、以下の状況に合わせて判断を下します。

1. ◆ ダイヤマーク(【警戒】収束の開始)

  • 意味: 相場のエネルギーが溜まり始めました(レンジ相場)。
  • 戦術: ここでエントリーしてはいけません。次に価格が上下どちらかに爆発するのを待つ「準備・監視」の合図です。

2. 最初の矢印(【初動】EMA5のブレイクアウト)

  • 意味: EMA5が、他の5本の束を完全にぶち抜きました。
  • 戦術: 収束状態のあとにこれが出たら、トレンド発生の一番早い初動サインです。アグレッシブに攻める(打診買い/売り)タイミングです。

3. 2番目の矢印(【トレンド】パーフェクトオーダーの拡散)

  • 意味: 全てのEMAが綺麗に並び、束が扇状に広がり始めました。
  • 戦術: トレンドが本格的に確定したサインです。最も勝率が高く安全なエントリーポイントとなります。

🔥 最強の黄金パターン 🔥 黄色の◆(エネルギー充電) > 初動の矢印(ブレイク) > 拡散の矢印(トレンド確定) この順番でシグナルが点灯した時は、最も期待値の高い鉄板の形(セットアップ)となります。

[ チャートへの適用方法 ]

  1. 対象のチャート(15分足など)に「EMA-Signal_BUY_SELL_V.2」を適用します。
  2. (推奨)視覚的にもわかりやすくするために、標準のEMAを6本(5, 9, 14, 19, 28, 38)チャート上に手動で追加表示してご利用ください。

Ringkasan

Ringkasan AI
EMA-Signal_BUY_SELL_V.2 is a custom trading indicator designed to identify early explosive price movements by analyzing six exponential moving averages (EMAs) with periods 5, 9, 14, 19, 28, and 38. It visually signals market phases including "Convergence" (energy building), "Breakout" (initial trend formation), and "Perfect Order Expansion" (confirmed trend) through distinct marks and alerts. The indicator supports bilingual display (English and Japanese), customizable signal colors, and an on/off pause switch for computations and alerts.
Key signals include:
1. Diamond Mark indicating market convergence and preparation phase.
2. First Arrow signaling EMA 5 breakout as an early trend entry point.
3. Second Arrow showing perfect EMA alignment confirming a strong trend.
Traders use these signals sequentially for timing entries, especially on volatile assets like US500, US100, and JP225, with a recommended setup on 15-minute charts alongside manually added EMAs for visual confirmation. The indicator focuses on visualization and alerting of trend strength, breakouts, and reversals based on EMA dynamics.
Profil indikator
Kategori indikator
Support & resistance
Tipe output
Visualisasi
Persyaratan data
Hanya batang
Sinyal yang didukung
Cross
Reversal
Breakout
Kekuatan tren

Ulasan pelanggan

5.0
Ulasan: 1
5
100 %
4
0 %
3
0 %
2
0 %
1
0 %
Ulasan pelanggan
July 16, 2026
EMA-Signal_BUY_SELL_V.2 is a well-structured multi-EMA indicator that tracks the 5-to-38 EMA cluster to visualize market phases. The "Golden Pattern" logic (Convergence → Breakout → Perfect Order) provides clear visual cues for both aggressive and conservative entries. V.2 adds excellent UX features like a pause switch, bilingual support (EN/JP), and full color customization. While it suffers from standard EMA lag, it’s a highly reliable tool for trend-following and volatile day trading.

Diskusi

Pertanyaan umum

EMA
Produk-produk yang tersedia melalui cTrader Store, termasuk bot trading, indikator, dan plugin, disediakan oleh pengembang pihak ketiga serta hanya ditujukan untuk akses teknis dan informasi. cTrader Store bukan broker dan tidak menyediakan saran investasi, rekomendasi pribadi, atau jaminan apa pun tentang kinerja di masa mendatang.

Produk lain dari penulis ini

cBot
EMA
Stochastic
+4
A robust, scalping-leaning day trading cBot for major indices (US500, US100, JP225). Buy setups only. Presets included.
10.6%
ROI
5.55
Faktor laba
cBot
EMA
Stochastic
+4
A robust, scalping-leaning day trading cBot for major indices (US500, US100, JP225). Sell setups only. Presets included.
10%
ROI
15.65
Faktor laba
cBot
EMA
Stochastic
+4
exclusively optimized for JPY denominated accounts, designed specifically for Swing Trading highly volatile indices.
8%
ROI
4.75
Faktor laba
cBot
EMA
Stochastic
+4
exclusively optimized for JPY denominated accounts, designed specifically for Swing Trading highly volatile indices.
10.5%
ROI
10.07
Faktor laba

Anda mungkin juga suka

Indikator
Prop
Forex
+2
Vision - Advanced Session Indicator
Indikator
RSI
EURUSD
+2
It identifies areas of market imbalance (Fair Value Gaps or FVGs) and projects them on the chart in a smart way
Indikator
RSI
Forex
+6
What Constance Brown did with the RSI was to input a momentum calculation within the RSI itself. This the Composite RSI.
Indikator
Forex
Crypto
+3
Day of Week Indicator for cTrader
Indikator
Customize your Moving Average! Choose any timeframe and price source for precision and flexibility in your analysis.
Indikator
BOS
MSS
+3
Maps BOS, CHoCH, swing breaks and market structure shifts directly on your cTrader chart.
Indikator
EMA
SMA
+2
Smart volume analysis with BP detection, trend confirmation and breakout signals for professional traders.
Indikator
Forex
Crypto
+6
The cTrader Chaos Reversals indicator brings high-quality reversal signals to traders.
Indikator
Prop
Institution-level trend Analyzer.
Indikator
Forex
Crypto
+6
Choppiness Index: identifies trending vs. ranging markets to filter breakouts and improve trend-following entries.
Indikator
Prop
Forex
+11
🌊 See when the market is truly in play. Tsunami measures Relative Volume by time-of-day 🌊
Indikator
VWAP
NAS100
+5
Key NY session opens for NASDAQ (US100) & SP500 to find Tick Precise Entrys for High R:R intraday setups.
Indikator
Forex
EURUSD
+5
With this Fibonacci retracement indicator, traders have full control over the retracement levels displayed on the chart.
Indikator
ATR
RSI
+7
Identifies market imbalances and visually marks key areas based on price patterns and volatility (ATR).
Indikator
ATR
Market Structure
Adaptive multi timeframe market condition analyzer that identifies the most tradeable timeframe.
Indikator
ATR
Engulfing
+5
This indicator maps D1, H4, H1 and 15M Multi-Timeframe Bias and Fresh High Probability Supply and Demand zones
Indikator
MSS
Key Levels
+2
Maps equal highs, equal lows and active liquidity pools directly on your cTrader chart.
Indikator
Signal
Cumulative Volume Delta tracks the net difference in tick volume between buying and selling pressure over time

Harga

Sejak 17/02/2025
63
Instal gratis