


Deskripsi
Apa yang dilakukannya
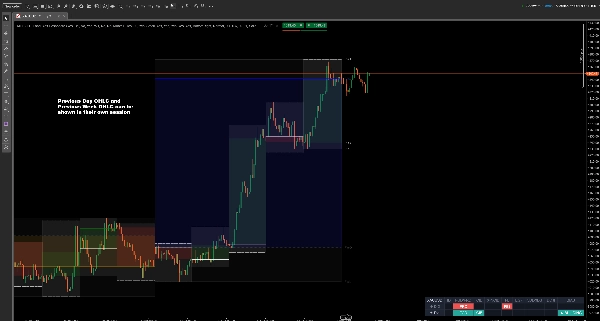
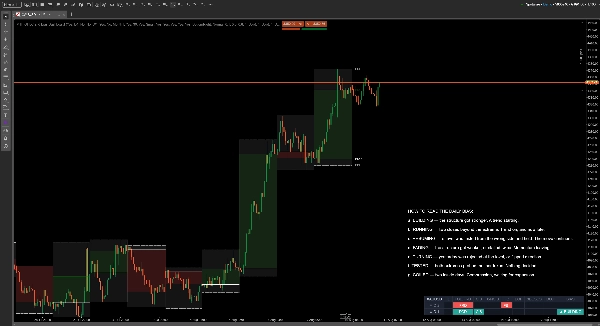
DASHBOARD OHLC dan BIAS MULTI-TIMEFRAME adalah indikator aksi harga multi-timeframe untuk cTrader. Ini menggambar level OHLC hari sebelumnya, minggu sebelumnya, dan bulan sebelumnya — buka, tinggi, rendah, dan tutup — ke grafik Anda, dan menambahkan dashboard yang membaca apa yang sebenarnya dilakukan harga pada level tersebut selama dua hari terakhir yang telah selesai.
Tinggi dan rendah hari sebelumnya (PDH dan PDL), pembukaan harian, tinggi dan rendah mingguan: ini adalah level support dan resistance timeframe lebih tinggi yang sudah digunakan oleh sebagian besar trader intraday dan swing. Apa yang biasanya mereka lakukan dengan mata setiap pagi adalah membandingkannya — apakah kemarin ditutup di atas hari sebelumnya? Apakah harga menembus tinggi hari sebelumnya dan gagal? Apakah pergerakan sedang membangun atau kehabisan ruang? Indikator ini menjawab pertanyaan-pertanyaan tersebut di grafik, dalam satu baris.
Level OHLC multi-timeframe
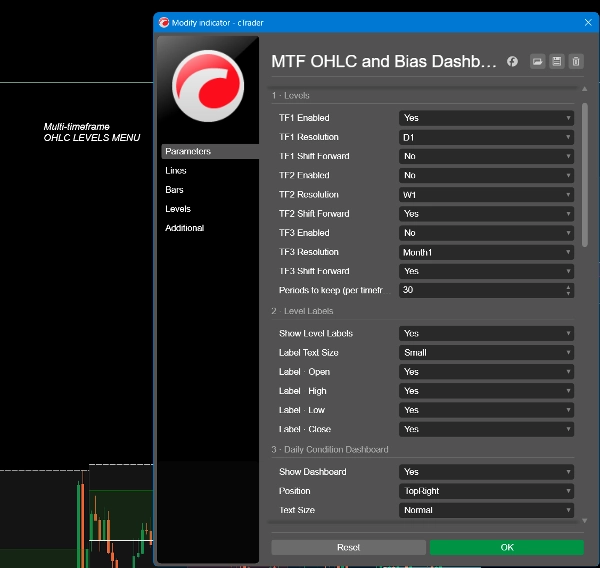
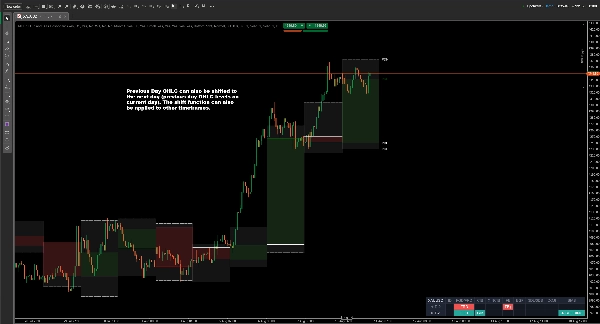
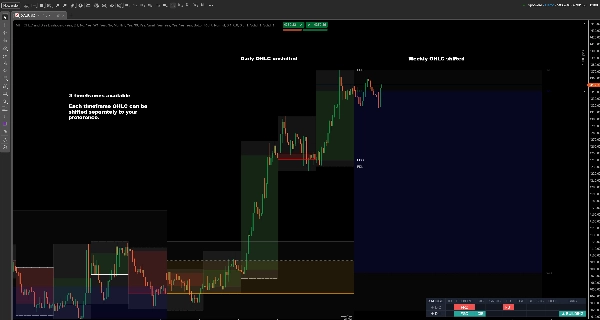
Hingga tiga timeframe sekaligus — harian, mingguan, bulanan, atau resolusi apa pun yang Anda pilih. Masing-masing menggambar buka, tinggi, rendah, dan tutupnya, dengan opsi badan yang diarsir dan pita dari tinggi ke rendah. Level dapat digeser ke depan sehingga referensi periode saat ini berada di depan harga, bukan di belakangnya, dan Anda dapat menyimpan hingga 70 periode historis di grafik.
Setiap garis memiliki warna, ketebalan, dan gaya sendiri, sehingga level support mingguan tidak pernah tertukar dengan level harian.
Dashboard kondisi harian
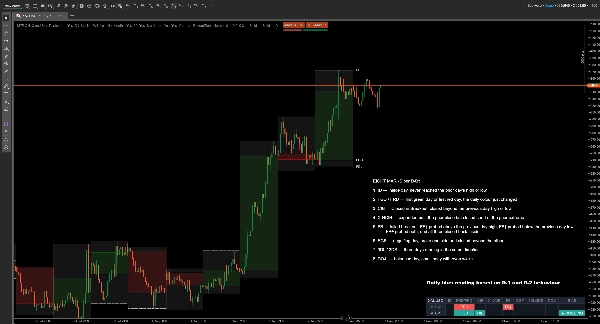
Dashboard menilai dua candle harian terakhir yang telah selesai — D-1 (kemarin) dan D-2 (hari sebelumnya) — masing-masing dibandingkan dengan hari yang mendahuluinya.
Sembilan tanda per hari:
- ID — inside day, tidak pernah mencapai tinggi atau rendah hari sebelumnya
- FGD / FRD — hari hijau pertama atau hari merah pertama, warna harian baru saja berubah (Hijau adalah hari bullish dan Merah adalah hari bearish)
- CIB — Ditutup dalam Breakout, ditutup melewati tinggi atau rendah hari sebelumnya
- X-NCIB — melebar melewati penutupan sebelumnya tetapi ditutup sebelum ekstrem sebelumnya (Expand Not Closed In Breakout = X-NCIB)
- FB — breakout gagal: FB↑ menyentuh di atas tinggi hari sebelumnya, FB↓ menyentuh di bawah rendah hari sebelumnya, FB± menyentuh keduanya, dan ketiganya ditutup kembali di dalam
- EGF — hari menelan, menembus satu sisi dan ditutup melewati sisi lainnya
- 3DL / 3DS — tiga hari berturut-turut dalam arah yang sama (3 Hari Long = 3DL / 3 Hari Short = 3DS)
- DOJI — hari seimbang, badan kecil dengan sumbu yang rata
- BIAS — pembacaan, dijelaskan di bawah
Cara membaca bias harian
Bias adalah bagian yang menghemat pekerjaan Anda. Setiap hari diringkas menjadi satu keadaan, dan bias berasal dari pergerakan antara D-2 dan D-1 — bukan hanya dari kemarin. Tanda yang sama berarti hal berbeda tergantung pada apa yang mendahuluinya, dan itulah yang tidak bisa diberitahukan oleh dashboard satu hari.
- MEMBANGUN — struktur menjadi lebih kuat. Tren mulai terbentuk.
- BERJALAN — dua penutupan melewati ekstrem. Tren berjalan, dan sekarang terlambat.
- MELANJUTKAN — sebuah level diuji dari sisi yang salah dan bertahan. Pergerakan berlanjut.
- MEMUDAR — struktur melemah, atau berhenti dua kali. Momentum meninggalkan.
- BERBALIK — kemarin ditolak di level tersebut, atau berbalik arah.
- TERUJI — kedua ekstrem disentuh, tidak ada yang diambil. Tidak ada keputusan.
- TERKOMPRESI — dua inside day. Kompresi, menunggu ekspansi.
Sebuah panah dan warna menunjukkan arah: hijau ke atas untuk bullish, merah ke bawah untuk bearish, abu-abu netral saat tidak ada arah yang diberikan.
Kedua baris detail tetap terlihat di atas bias, sehingga Anda selalu dapat melihat mengapa pembacaan seperti itu daripada mempercayai kotak hitam.
Penggunaan tipikal
Buka grafik di pagi hari, baca bias, dan ketahui sebelum sesi dimulai apakah Anda mencari kelanjutan, penurunan, atau rentang. Kemudian trading dengan setup Anda sendiri terhadap level yang digambar — tinggi dan rendah hari sebelumnya, pembukaan harian, ekstrem mingguan.
Cocok untuk kerja rentang pembukaan, trading breakout gagal, dan strategi kelanjutan hari ke hari. Berguna di forex, indeks, logam, dan kripto.
Pengaturan
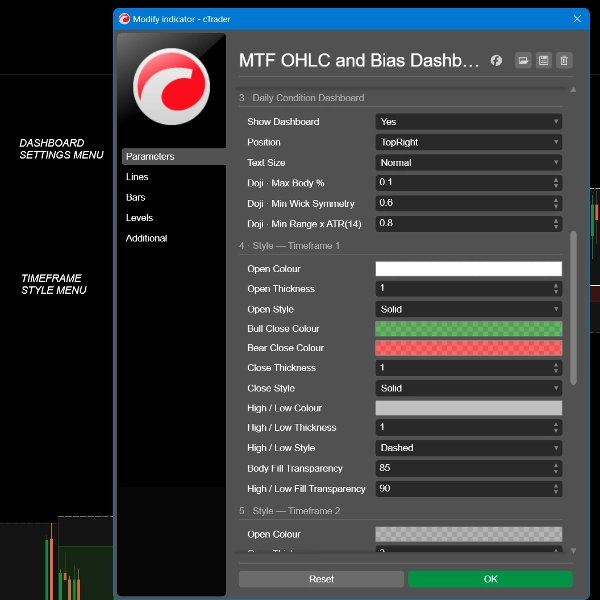
- Tiga slot timeframe independen, masing-masing dengan resolusi sendiri, toggle geser-maju dan kontrol penuh warna, ketebalan, dan gaya
- Jumlah periode historis yang disimpan, hingga 70
- Label level hidup atau mati, per tipe garis, dengan ukuran teks yang dapat disesuaikan
- Dashboard hidup atau mati, lima posisi layar, empat ukuran teks
- Sensitivitas Doji: persentase badan maksimum, simetri sumbu minimum, rentang minimum relatif terhadap rata-rata 14 hari
******************************************************
Untuk siapa ini
Trader intraday dan swing yang sudah bekerja dengan level hari sebelumnya dan minggu sebelumnya. Ini mengasumsikan Anda tahu apa itu tinggi hari sebelumnya dan mengapa itu penting. Jika level tersebut belum menjadi bagian dari cara Anda trading, ini tidak akan mengajarkan Anda cara menggunakannya.
Apa yang tidak dilakukannya
Menjelaskan hal ini sekarang menghemat waktu kita berdua nanti:
- Tidak memberikan sinyal beli atau jual, dan tidak ada harga masuk atau keluar
- Tidak menempatkan order dan tidak dapat mengakses akun Anda — indikator berjalan tanpa hak akses sama sekali
- Tidak memiliki peringatan atau notifikasi
- Tidak memprediksi apa pun. Setiap tanda menggambarkan candle yang sudah ditutup
- Tidak melakukan repaint. Dashboard hanya membaca candle harian yang telah selesai, jadi pembacaan tidak pernah berubah setelah fakta
- Bukan strategi. Bias menggambarkan struktur; tidak merekomendasikan trading
********************************************************
Hal yang perlu diketahui
Dashboard membutuhkan setidaknya empat candle harian yang telah selesai, jadi simbol yang baru terdaftar akan menunjukkan tanda strip sampai memiliki cukup riwayat.
Candle harian dimulai pada waktu server broker Anda. Dua broker pada instrumen yang sama dapat memotong hari pada jam yang berbeda, yang berarti simbol yang sama dapat dibaca berbeda secara sah di dua platform. Itu adalah sifat data, bukan kesalahan pada indikator.
Di atas timeframe harian dashboard tidak dapat membaca data harian dan menunjukkan peringatan TF > D. Level tetap digambar.
Trading melibatkan risiko. Kinerja masa lalu tidak menjamin hasil di masa depan.
Ringkasan
A central feature is the two-day price action bias dashboard, which analyzes the last two completed daily candles relative to their preceding days. It categorizes daily price behavior into nine distinct patterns (e.g., inside day, first green/red day, failed breakout, engulfing day) and summarizes the overall bias into states such as building, running, fading, or turning. Directional bias is indicated with colored arrows (green for bullish, red for bearish, grey for neutral), helping traders quickly assess market structure without guesswork.
Designed for intraday and swing traders familiar with previous day and week levels, the indicator does not provide trade signals, alerts, or order execution. It is suitable for forex, indices, metals, and cryptocurrencies, aiding strategies like opening-range, failed-breakout, and continuation trading by clearly marking key levels and daily price action context.
Diskusi
Ulasan pelanggan
Pertanyaan umum
Produk lain dari penulis ini












![Logo "[Stellar Strategies] Market Session Ultimate"](https://cdn.ctrader.com/image/webp/61ffd537-0125-4246-9e72-42eca1791d64_28232)







Harga