present
Registe-se e receba 50 $ de desconto na sua primeira compra
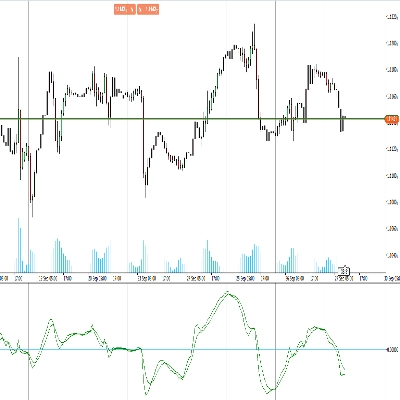
Trading product for MidasVolumeProfile Indicador Key Levels Volume, image 1
MidasVolumeProfile
Indicador
Versão 1.3, Oct 2026
Windows, Mac
Trading product for MidasVolumeProfile Indicador Key Levels Volume, image 2
Trading product for MidasVolumeProfile Indicador Key Levels Volume, image 3
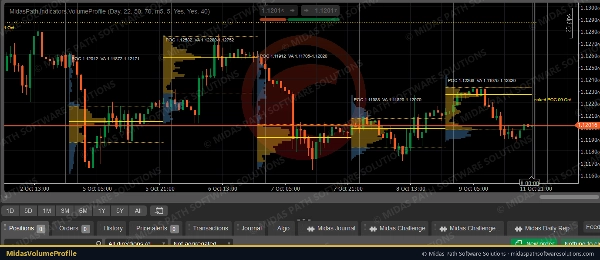
Trading product for MidasVolumeProfile Indicador Key Levels Volume, image 4
Desde 27/09/2026

Descrição

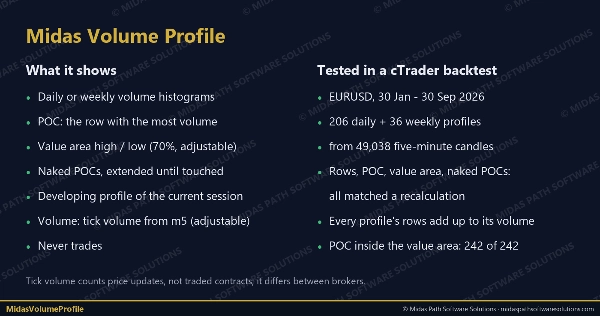
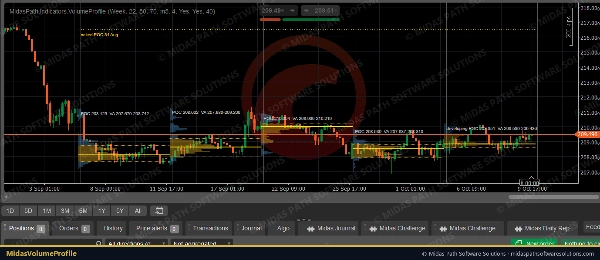
Midas Volume Profile shows where volume traded in each day or week, drawn as a histogram at the start of the session, with the levels profile traders use.


What it shows

• A volume histogram for each session, with the value area highlighted.

• POC (point of control): the price row with the most volume, drawn across the session.

• Value area high and low (VAH / VAL): the range around the POC that holds 70% of the session's volume (adjustable).

• Naked POCs: earlier sessions' POCs that price has not traded through since, extended to the right until price touches them.

• The developing profile of the current session, updated as each candle closes.


How it is built

• Volume is cTrader's tick volume (the number of price updates), the usual measure in forex and CFDs, where there is no central exchange volume. It is taken from a lower timeframe (5 minutes by default) for detail.

• Each candle's volume is shared across the price rows its high-low range covers, in proportion to the overlap. The session's range is split into 50 rows (adjustable).

• The value area grows from the POC towards whichever neighbouring row holds more volume, until it holds the chosen share.


Settings

• Profiles per day or per week, session start hour (22:00 UTC by default, the forex day), rows, value-area share, volume timeframe.

• Number of sessions shown, developing session on or off, naked POCs on or off, histogram width and colours.


Tested

• In a cTrader backtest on EURUSD (30 Jan-30 Sep 2026), all 206 daily and 36 weekly profiles built from 49,038 five-minute candles matched an independent recalculation: session boundaries, every row's volume (each profile's rows add up to its total volume), POC, value area and every naked-POC touch.

• On that data the POC sat inside the value area in every profile, the value area held 71% of volume on average (rows are whole, so it slightly exceeds 70%), and 10 daily and 2 weekly POCs were still naked at the end.


Notes

• Tick volume counts price changes, not traded contracts; it differs between brokers.

• Volume profiles describe where trading happened; they do not predict where price will go.

• It never trades and needs no internet or file access.

Resumo

Resumo de IA
Midas Volume Profile is an indicator that visualizes session volume distribution using tick volume data, primarily for forex and CFD markets where centralized volume is unavailable. It displays a histogram of traded volume for each day or week at the session start, highlighting key levels used by volume profile traders.

Key features include:
- Point of Control (POC): the price level with the highest traded volume, extended across the session.
- Value Area High and Low (VAH/VAL): price range around the POC containing approximately 70% of the session’s volume, adjustable by the user.
- Naked POCs: POCs from previous sessions that price has not revisited, extended until touched.
- A developing profile for the current session, updated with each candle close.

The indicator calculates volume by distributing each candle’s tick volume proportionally across price rows within its high-low range, dividing the session range into adjustable rows (default 50). It supports profiles per day or week, customizable session start times, and visual settings such as histogram width and colors.

Midas Volume Profile operates without trading or internet access and has been tested for accuracy against independent recalculations on EURUSD data. It provides a detailed view of where trading activity concentrates but does not predict price direction.
Perfil do indicador
Categoria do indicador
Volume
Tipo de resultado
Visualização
Requisitos de dados
Apenas barras

Conversa

Avaliações de clientes

0.0
Avaliações: 0
Avaliações de clientes
Ainda não há avaliações para este produto. Já o experimentou? Seja o primeiro a contar a outras pessoas!

Perguntas frequentes

Key Levels
Volume
Support & Resistance
Os produtos disponíveis através da cTrader Store, incluindo bots de negociação, indicadores e plugins, são fornecidos por programadores terceiros e são disponibilizados apenas para fins informativos e de acesso técnico. A cTrader Store não é um corretor e não fornece aconselhamento em matéria de investimento, recomendações pessoais ou qualquer garantia de desempenho no futuro.

Mais deste autor

Plugin para desktop
File Access
Trade Journal
Your watchlist in one grid: trend on five timeframes, ADR used, correlation to the chart's symbol, currency strength.
Indicador
Key Levels
Liquidity Grab
+2
The levels you mark each morning, drawn and followed: PDH/PDL, weekly, monthly, sessions, equal highs/lows.
cBot
Partial Close
Prop Firm Fit
Copies opens, closes, partial closes and SL/TP from one cTrader account to others on the same PC, with safe sizing.
Plugin para desktop
External Data
Study economic event reactions with broker M1 history, bar replay, range comparisons and a reproducible export.

Também poderá gostar de

Indicador
ATR
MSS
+5
Advanced market structure and institutional cycle mapper with visual reference cards and entry alerts
Indicador
BB Breakout Oscillator with alerts! Spot trend reversals using Bollinger Bands. Bullish/Bearish crossovers Alerts.
Indicador
AI
SMC
+9
Identifies market trends (-10 to +10) using HMA with volume confirmation. Includes customizable alerts.
Indicador
Signal
Dark Poll Signal Indicator.liquidity leakage,precedes the great movement, accumulation, distribution
Indicador
ATR
BOS
+5
Opening ranges, dynamic trend channels, and multi-scale breakout/retest analysis for clear intraday chart decisions.
Indicador
ATR
Channel
+1
Bollinger Bands Advanced Squeeze & Breakout System, Real-Time On-Chart Dashboard, Auto-Squeeze Detector, Dual-Band Cloud
Indicador
SMC
Prop
+14
an all-in-one Smart Money Concepts (SMC) toolkit featuring Premium/Discount zones.
Indicador
Drawdown Monitor
Protect your funded account. Real-time Daily Equity Drawdown monitor with Green / Orange / Red flashing alerts.
Indicador
Forex
BTCUSD
+10
Enhance trading with TSI! Use the True Strength Index for clear insights into market momentum and trend strength.
Indicador
Key Levels
Support & Resistance
Clean psychological round-number grid with native pip and point auto-scaling across Forex, Gold, Indices, and Crypto.
Indicador
SMC
Prop
+12
Multi-TF FVG + Smart Fibonacci
Indicador
Forex
Identify 34 candlestick patterns, track trends across timeframes, and get instant alerts with this powerful trading tool
Indicador
ATR
Forex
+6
UT Bot Alerts Nova: Advanced trend-following indicator using ATR for signals. Precise entries/exits.
Indicador
VWAP
Forex
+13
Custom VWAP Indicator for cTrader
Indicador
RSI
Forex
+4
😎Read the description before purchasing💩
Indicador
BOS
EMA
+5
Market structure signals graded A to C, each with a drawn trade plan, plus an adaptive trend ribbon and a trend matrix
Indicador
Forex
EURUSD
+3
ATR-normalized MA slope in degrees, comparable across all instruments. Color-coded labels flag strong trend moves.
Indicador
ATR
Key Levels
+1
Explore 88 harmonic price-pattern variants with interactive chart controls and geometric reference levels.

Preço

Desde 27/09/2026