



Description
Replace traditional candlesticks with eye-catching pyramid-shaped candles that enhance price action clarity while preserving all key market data (Open, High, Low, Close). Perfect for traders who want a fresh, intuitive way to analyze trends and reversals.
Key Features:
✅ Unique Pyramid Design – Each candle is displayed as two triangles (upper & lower), forming a clear price structure.
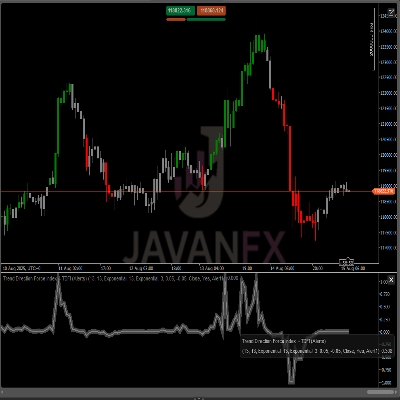
✅ Instant Trend Recognition – Bullish (green) and bearish (red) candles are color-coded for quick analysis.
✅ Customizable Width – Adjust the pyramid size (10-200%) for optimal visibility on any timeframe.
✅ Wick Display Option – Toggle wicks (high-low range) on/off for cleaner or more detailed charts.
✅ Works on All Timeframes – From M1 to Monthly, seamlessly adapts to your trading style.
✅ Clear Price Action – Maintains all candlestick data in an innovative visual format.
Why Traders Love It:
🔹 Easier Pattern Detection – Triangular shapes make trends and reversals stand out.
🔹 Reduced Chart Clutter – Simplifies price action without losing key information.
🔹 Fully Customizable – Personalize colors, width, and wicks to match your strategy.
🔹 Perfect for All Markets – Works on Forex, Stocks, Crypto, and Indices.
How It Works:
Automatically replaces candlesticks with pyramids while keeping the same OHLC data.
Upper triangle = High to body top (bullish/bearish close).
Lower triangle = Low to body bottom.
Optional wick shows the full price range.
Get an Edge in Trading!
🚀 Stand out from the crowd with a unique charting style.
🚀 Improve decision-making with clearer trend visualization.
🚀 Customize it your way – adapt colors and sizing to your preferences.
Ideal for:
✔ Price action traders
✔ Swing traders
✔ Technical analysts
✔ Anyone tired of traditional candlesticks!
Summary
Key features include a unique pyramid design for clear price structure visualization, color-coded bullish (green) and bearish (red) candles for instant trend recognition, and customizable pyramid width (10-200%) to suit different timeframes and preferences. The indicator works seamlessly across all timeframes, from 1-minute to monthly charts, and supports various markets including Forex, Stocks, Crypto, and Indices.
This tool aims to simplify chart analysis by reducing clutter and making trend and reversal patterns easier to detect. It is suitable for price action traders, swing traders, and technical analysts seeking an alternative visual approach to traditional candlesticks. Users can personalize colors, sizing, and wick display to align with their trading strategies.
Discussion
Customer reviews
5 | 50 % | |
4 | 50 % | |
3 | 0 % | |
2 | 0 % | |
1 | 0 % |
FAQ
More from this author





Price