present
Registrati e ricevi uno sconto da $50 sul tuo primo acquisto
Trading product for CVD_Per-Bar Delta Indicatore Volume, image 1
CVD_Per-Bar Delta
Indicatore
Versione 1.0, May 2026
Windows, Mac
Trading product for CVD_Per-Bar Delta Indicatore Volume, image 2
Trading product for CVD_Per-Bar Delta Indicatore Volume, image 3
Trading product for CVD_Per-Bar Delta Indicatore Volume, image 4
Trading product for CVD_Per-Bar Delta Indicatore Volume, image 5
Trading product for CVD_Per-Bar Delta Indicatore Volume, image 6
Trading product for CVD_Per-Bar Delta Indicatore Volume, image 7
Da 23/04/2026

Descrizione

A candle shows you the outcome. It doesn't show you who did the work.

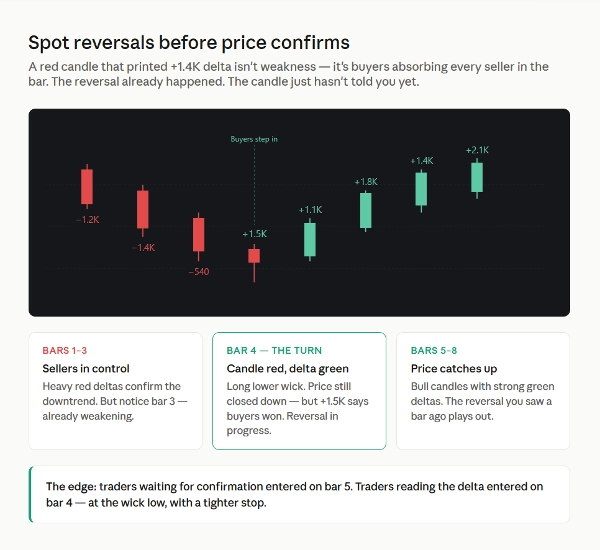
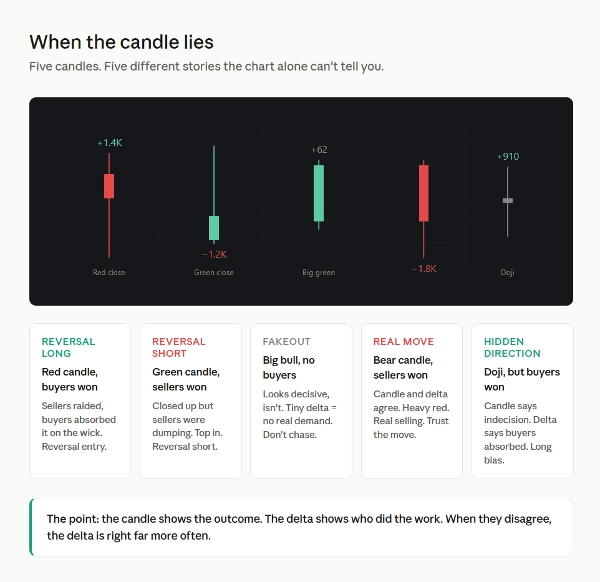
A bullish candle can close green while sellers were dumping into the rally. A bearish candle can close red while buyers absorbed every seller in the bar. A doji can hide a +900 delta of one-sided pressure. Price action alone can't tell you. Volume alone can't tell you. You need to know who won.

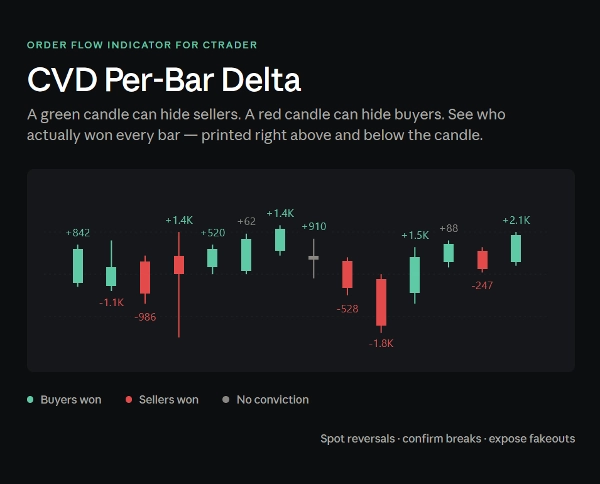
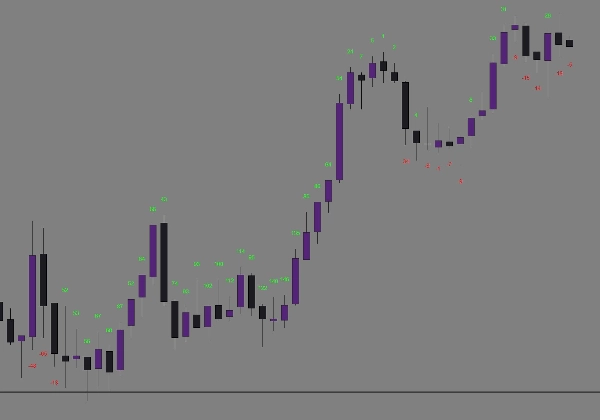
CVD Per-Bar Delta uses tick-rule classification on real cTrader tick data to count buyers vs sellers inside every candle, then prints the result directly on your chart as a colour-coded number. One glance and you know whether bulls or bears were in control — and by how much.

What you see:

  • A green number above buyer-dominated bars
  • A red number below seller-dominated bars
  • Number size scales with conviction — small numbers mean a fair fight, big numbers mean one side dominated

Where it earns its place:

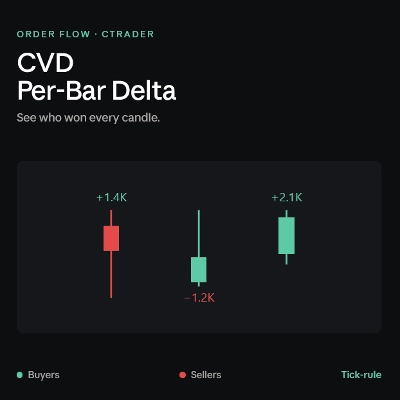
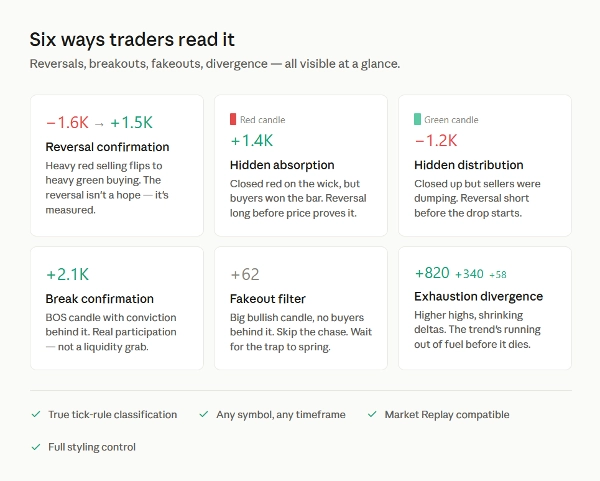
Reversal confirmation. A red candle that printed +1.4K delta isn't weakness — it's buyers absorbing every seller in the bar. The reversal already happened. The candle just hasn't told you yet. Enter at the wick low with a tight stop, while everyone else waits for the next candle to confirm.

Hidden absorption (long setups). Price spikes down into your support zone or order block. Long lower wick. Big green number. Buyers swallowed the raid. That's a high-probability reversal long — and the delta saw it before the candle closed.

Hidden distribution (short setups). Price grinds higher into resistance. Each green candle prints smaller delta than the last, then a green candle closes with a red delta. Buyers exhausted, sellers dumping into the rally. Top in. Short.

Break confirmation. A BOS candle with a strong delta in the break direction is real participation. Same break with a weak or opposite-coloured delta is a liquidity grab dressed as a breakout. Filter the fakeouts before you take them.

Exhaustion divergence. Price keeps making higher highs but the green deltas are getting smaller with each push. Buyers are running out of ammunition. The trend is dying before it dies.

Conviction filter. Two candles look identical on the chart. One has +850 delta. The other has +40. They are not the same candle. Skip the noise. Take the conviction bars.

Built for serious traders:

  • True tick-rule classification using cTrader's tick data — not synthetic OHLC approximation
  • Works on any symbol, any timeframe, any chart
  • Compatible with Market Replay for back-testing your read
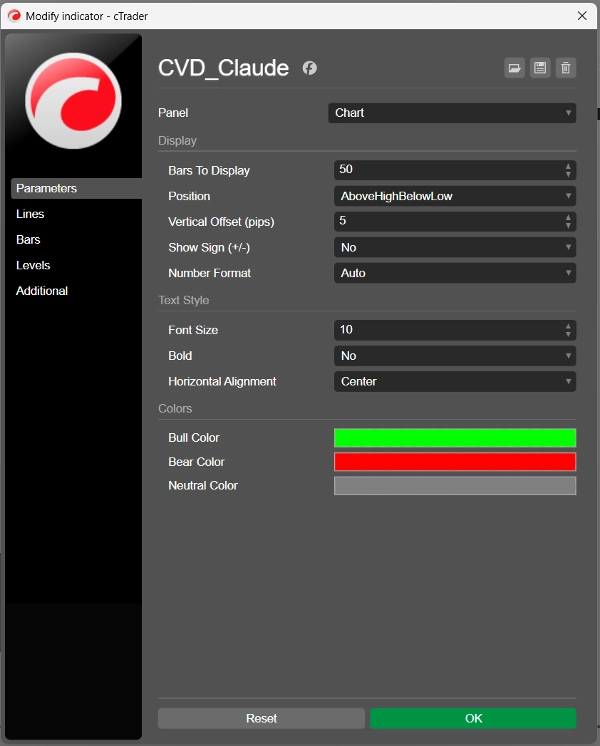
  • Last 50 bars by default, fully configurable — zero clutter

Full styling control:

  • Position — above bar, below bar, or smart (above highs for bull bars, below lows for bear bars)
  • Text — font size 6 to 30, optional bold, alignment options
  • Colours — bull, bear and neutral pickers, match any chart theme
  • Format — raw numbers, K-thousands, or auto-switching
  • Display — adjustable pip offset, sign toggle, bar count

Important: This indicator requires tick data. Live charts use it automatically. For Market Replay, select "Tick data" when starting your replay session.

Pairs especially well with: order block / SMC strategies, reversal trading at key levels, breakout systems, mean-reversion setups, and any methodology that benefits from confirming intent behind a candle.

The chart shows you what happened. The delta shows you why.
Riepilogo

Profilo indicatore
Categoria indicatore
Volume
Tipo di output
Visualizzazione
Requisiti per i dati
Dati sui tick
Segnali supportati
Divergenza

Discussioni

Recensioni dei clienti

0.0
Recensioni: 0
Recensioni dei clienti
Questo prodotto non ha ancora ricevuto recensioni. L'hai già provato? Fallo sapere agli altri per primo!

Domande frequenti

Volume
I prodotti disponibili tramite cTrader Store, inclusi bot di trading, indicatori e plugin, sono forniti da sviluppatori terzi e resi disponibili esclusivamente a scopo informativo e di accesso tecnico. cTrader Store non è un broker e non fornisce consulenze in materia di investimento, raccomandazioni individualizzate o garanzie di risultati futuri.

Potrebbe interessarti anche

Indicatore
Forex
BTCUSD
+11
📈 Adaptive ALMA-Gaussian hybrid trend filter with precision smoothing and clear buy/sell signals.
Indicatore
Supertrend
Moving Average
Easy Trade: Trend & Breakout Indicator for cTrader
Indicatore
Forex
Identify 34 candlestick patterns, track trends across timeframes, and get instant alerts with this powerful trading tool
Indicatore
AI
ATR
+26
Exploit market imbalances with auto FVG zones—fade, extend, and filter with precision.
Indicatore
ATR
Wedge
+2
Strong Supertrend Turn Market Movement into a Clear Map Market analysis
Indicatore
Prop
Forex
+11
🧭 See when your market tends to move—by Month, Day-of-Week, or Hour-of-Day🧭
Indicatore
SMC
VWAP
+16
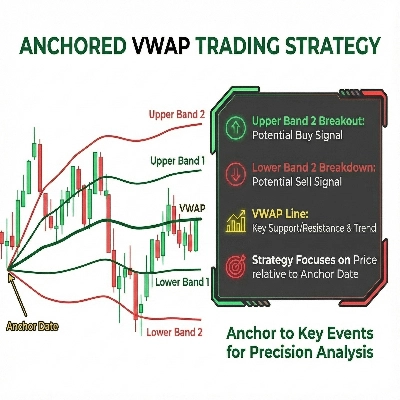
It calculates Anchored VWAP and StdDev bands from a user-defined start date for cTrader charts.
Indicatore
Block Liquidity,indicator.Block Order, Liquids Stops, Signal Sentiment,signal correctio.
Indicatore
MACD
Forex
+6
Auto Signal BUY SELL is a professional decision-making tool designed to help you follow the trend and capture high-proba
Indicatore
AI
BOS
+4
Golden Boom and Crash Spike Detector is a trading tool designed for Crash 300 and Boom 300 indices on M1 Timeframe.
Logo di "SCOB"
Più votato
4.4
(5)
$19
/
$20
Indicatore
SMC
Prop
+12
SCOB - Single Candle Order Block Indicator
Indicatore
Forex
Crypto
+6
The cTrader Chaos Reversals indicator brings high-quality reversal signals to traders.
Indicatore
BOS
EMA
+5
Market structure signals graded A to C, each with a drawn trade plan, plus an adaptive trend ribbon and a trend matrix
Indicatore
AI
RSI
+7
EMA MTF TREND PRO - Multi-timeframe trend analysis overlay indicator, 6 timeframes - in one table with ADX
Indicatore
ATR
EMA
+5
Candle timer with live profit tracking on chart – displays pips, currency value, and percentage in real time.
Indicatore
Key Levels
Liquidity Grab
+2
The levels you mark each morning, drawn and followed: PDH/PDL, weekly, monthly, sessions, equal highs/lows.
Indicatore
Prop
Crypto
+5
VIX Pro: Confirm Real Breakouts & Filter Market Noise with Volatility
Indicatore
ATR
Scalping
+1
Auto Fibonacci Retracement Pro – Smart Swing & Golden Zone Levels

Prezzo

Da 23/04/2026