Automatic Fibonatti - Renko
Indicatore
Versione 1.0, Feb 2025
Windows, Mac
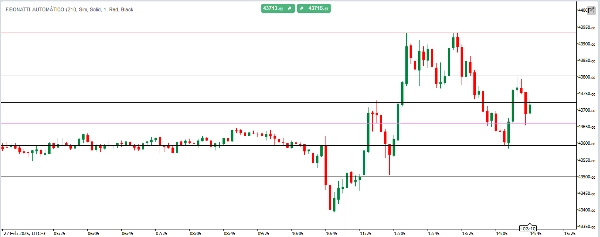
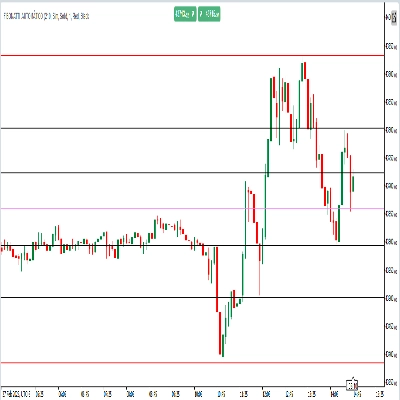
Auto Fibonacci RENKO per cTrader
Identifica automaticamente i livelli di prezzo chiave — completamente personalizzabile in base alla tua strategia.
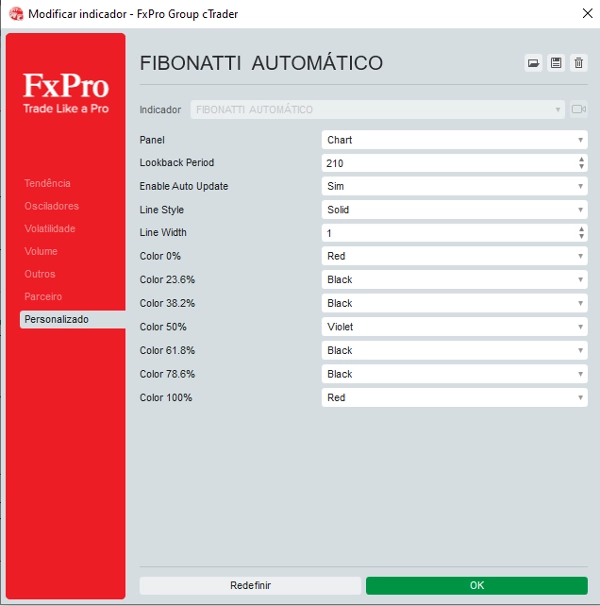
Auto Fibonacci è un indicatore intelligente e flessibile che traccia automaticamente i livelli di ritracciamento di Fibonacci basati sui prezzi più alti e più bassi in un periodo definito dall'utente. Ciò che lo distingue è la sua completa personalizzazione: personalizza il colore, lo stile della linea e lo spessore di ogni livello di Fibonacci per adattarlo alle tue preferenze visive e alla strategia di trading. Include anche aggiornamenti in tempo reale, così il tuo grafico riflette sempre l'azione del prezzo più recente — senza bisogno di aggiustamenti manuali.
Profilo indicatore
0.0
Recensioni: 0
Recensioni dei clienti
Questo prodotto non ha ancora ricevuto recensioni. L'hai già provato? Fallo sapere agli altri per primo!
I prodotti disponibili tramite cTrader Store, inclusi bot di trading, indicatori e plugin, sono forniti da sviluppatori terzi e resi disponibili esclusivamente a scopo informativo e di accesso tecnico. cTrader Store non è un broker e non fornisce consulenze in materia di investimento, raccomandazioni individualizzate o garanzie di risultati futuri.


Da 05/02/2025
30
Vendite