

説明
Vice TrendTrading
「マルチタイムフレームトレンドロジックによる高度なトレンドゾーン&精密エントリー矢印」
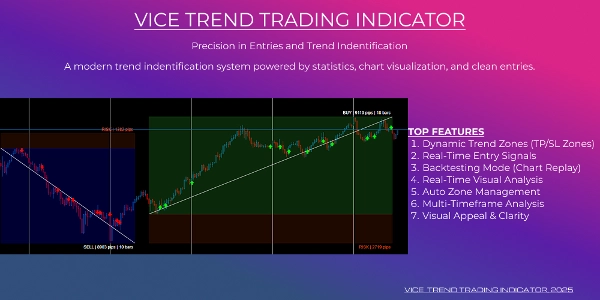
これは単なるトレンドインジケーターではなく、完全な視覚的トレーディングシステムであり、市場のトレンドを見つける、リアルタイムで市場のパフォーマンスを追跡する、そしてトレンド結果を明確に分析するために設計されています。
この高度なツールは、マルチタイムフレームトレンド分析、リアルタイムの損益オーバーレイ、および自動シグナル矢印を一つのクリーンで強力なチャート体験に統合しています。
主な特徴:
1. ダイナミックトレンドゾーン(TP/SLビジュアル)
概要
AIによる概要
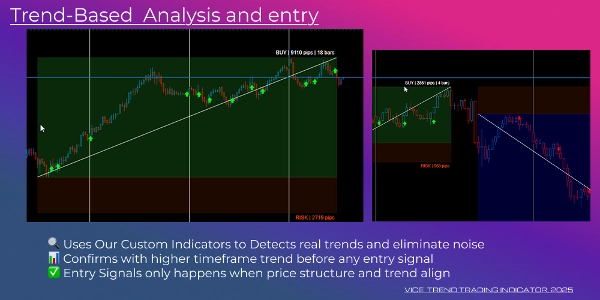
Vice TrendTrading is a comprehensive visual trading indicator designed to identify and track market trends using multi-timeframe analysis. It provides dynamic trend zones that visually mark entry areas, take profit targets, and stop loss levels with high precision. These zones update in real time, displaying profit and loss metrics in dollars, pips, and percentages.
The system includes automatic signal arrows that confirm valid buy and sell entries within active trend zones, ensuring signals appear only at valid entry points without repainting or duplication. It supports historical signal reconstruction for chart replay, allowing users to visually backtest and analyze past market behavior accurately.
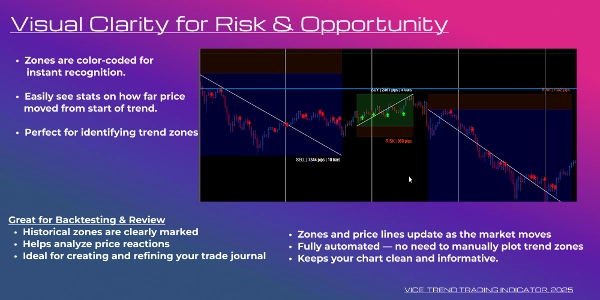
Vice TrendTrading manages trend zones automatically by closing and labeling completed zones when trends reverse, maintaining clean and organized charts even in volatile conditions. The indicator features color-coded zones and arrows with annotated profit/loss values for clarity and ease of interpretation.
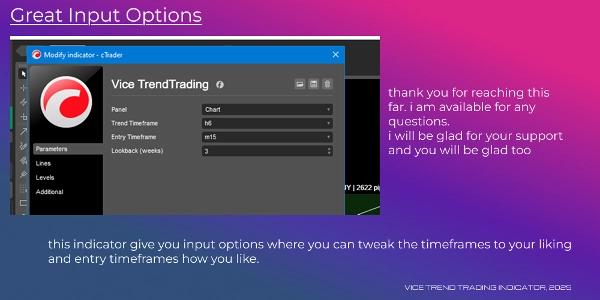
It works on all symbols and any timeframe, with customizable input parameters for trend and entry timeframes. This tool is suited for price action traders, discretionary traders, strategy developers, and anyone seeking a structured, modern chart to make informed trading decisions.
The system includes automatic signal arrows that confirm valid buy and sell entries within active trend zones, ensuring signals appear only at valid entry points without repainting or duplication. It supports historical signal reconstruction for chart replay, allowing users to visually backtest and analyze past market behavior accurately.
Vice TrendTrading manages trend zones automatically by closing and labeling completed zones when trends reverse, maintaining clean and organized charts even in volatile conditions. The indicator features color-coded zones and arrows with annotated profit/loss values for clarity and ease of interpretation.
It works on all symbols and any timeframe, with customizable input parameters for trend and entry timeframes. This tool is suited for price action traders, discretionary traders, strategy developers, and anyone seeking a structured, modern chart to make informed trading decisions.
インジケーターのプロフィール
ディスカッション
カスタマーレビュー
4.6
レビュー: 3
5 | 67 % | |
4 | 33 % | |
3 | 0 % | |
2 | 0 % | |
1 | 0 % |
カスタマーレビュー
July 18, 2025
Two sessions say more than one clean chart, and the market read feels cleaner.
July 15, 2025
not perfect, but the workflow felt cleaner, and A small account test feels safer.
July 7, 2025
Not perfect, but the workflow felt cleaner. It needs a few bad trades in the sample too.
よくあるご質問
cTrader Storeで入手可能な取引ボット、インジケーター、プラグインなどの商品は、第三者の開発者が提供するものであり、情報と技術の取得のみを目的としてご利用いただけます。cTrader Storeはブローカーではなく、投資助言や個人的な推奨を行うことも、将来のパフォーマンスを保証することもありません。






![「High-Low Divergence [Iridio Capital]」ロゴ](https://cdn.ctrader.com/image/webp/10a9e91b-243a-43f6-bbfe-7376bad5a214_61554)



![「[CB] Pivot Points Pro」ロゴ](https://cdn.ctrader.com/image/webp/43463c82-67b0-4f10-a4ba-901bba091d81_32594)





![「[Stellar Strategies] Market Session Ultimate」ロゴ](https://cdn.ctrader.com/image/webp/61ffd537-0125-4246-9e72-42eca1791d64_28232)

価格

登録日 17/06/2025