Trend Strength Signals St3llars33r
Indicador
Versión 1.0, Aug 2025
Windows, Mac
Desde 26/05/2025
451.48M
Volumen operado
61.16K
Pips ganados
15
Ventas
1.43K
Instalaciones gratis
Descripción
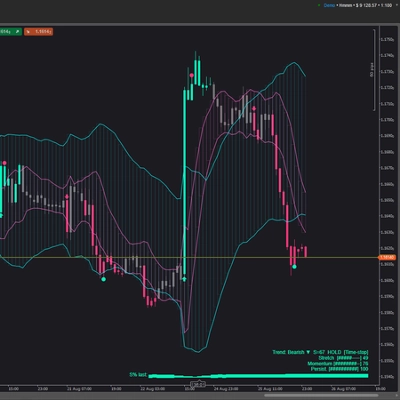
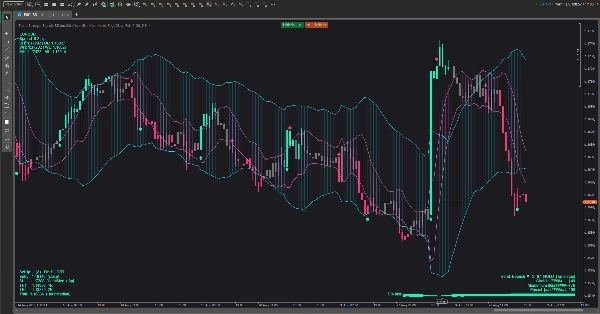
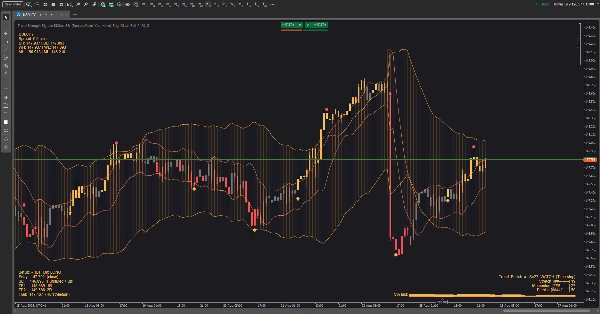
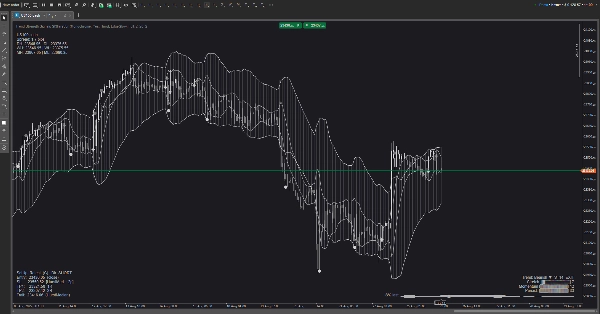
Un conjunto de herramientas visual para el trading de tendencias que combina un envolvente de volatilidad con un canal consciente del ciclo para mostrar el régimen, el momento y el riesgo de un vistazo. Está diseñado para ser legible en cualquier fondo (claro/oscuro) y para mantener la pantalla limpia mientras te da pistas sobre “qué hacer a continuación”.
Lo que ves en el gráfico
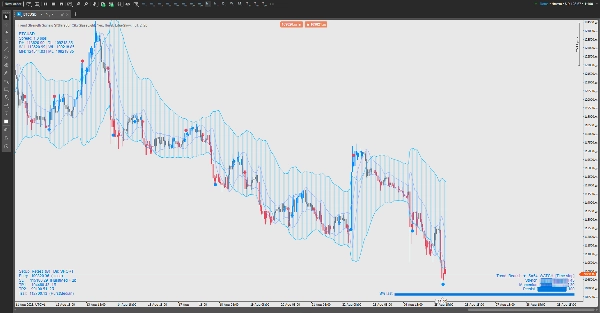
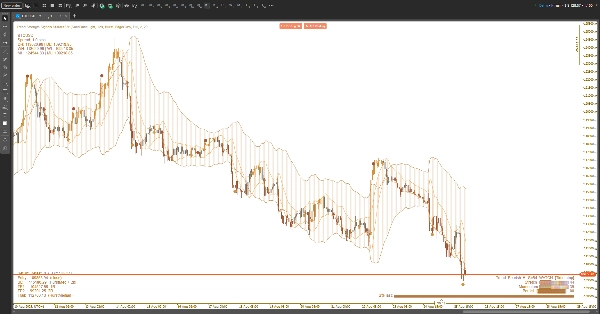
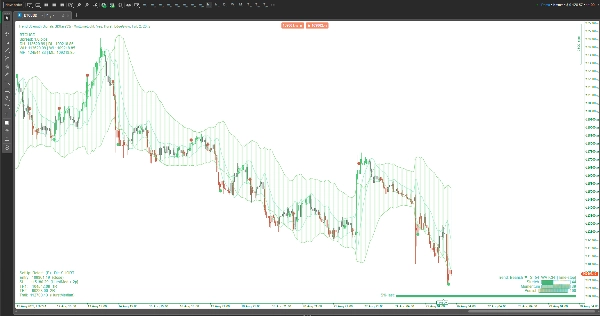
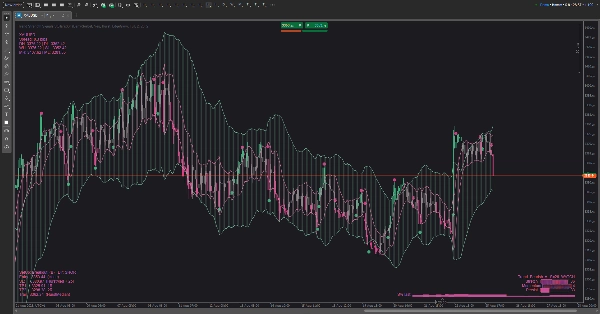
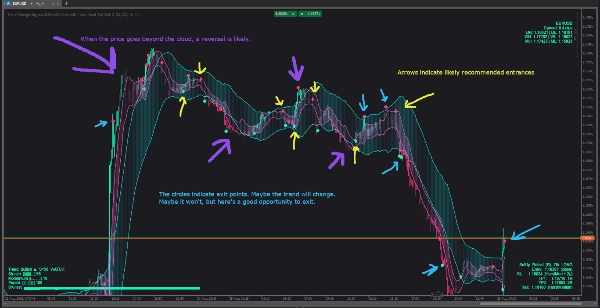
- Nubes (activables):
-
- Una nube de volatilidad que se expande/contrae con la actividad del mercado.
- Una nube de ciclo que sigue el ritmo continuo del precio.
- Puedes mostrar una, ambas o ninguna.
- Señales: flechas sutiles hacia arriba/abajo para posibles cambios de tendencia; pequeños puntos para indicaciones de toma de ganancias.
- HUD de Fuerza de Tendencia (tres estilos):
-
- Ligero — una etiqueta de estado compacta.
- Pro — un pequeño panel con tres medidores (estiramiento, impulso, persistencia) más una mini línea de historia.
- Cinta — una barra suave cerca del precio cuya intensidad sigue la fuerza de la tendencia.
- HUD de Riesgo: propone una dirección, un área de stop protectora, dos objetivos de beneficio en capas y una idea opcional de trailing. Se sitúa en cualquier esquina que elijas y se actualiza conforme evoluciona la barra.
- HUD de Mercado: símbolo y spread, más referencias de máximo-mínimo día/semana/mes, para que siempre sepas dónde estás dentro del mapa más grande.
- Temas: conjuntos de colores seleccionados para gráficos claros y oscuros (y un modo Personalizado). Todos los elementos gráficos—incluidos HUDs y señales—siguen el tema activo.
Cómo usarlo (práctico, no técnico)
- Elige tu vista de nube:
-
- Usa la nube de volatilidad para ver compresiones y expansiones.
- Usa la nube de ciclo para juzgar rotaciones “en el borde” vs “en el medio”.
- Usa ambas si quieres contexto + sincronización.
- Lee la Fuerza de la Tendencia:
-
- Cuando el estado escala a HOLD, favorece operaciones con la dirección actual; cuando baja a WATCH, reduce la agresividad; si muestra EXIT, evita operaciones nuevas o ajusta el riesgo.
- En modo Pro, medidores ascendentes + línea de historia ascendente = calidad mejorando; medidores en descenso = gestiona el riesgo a la baja.
- Temporiza las entradas con el precio vs la nube:
-
- Rupturas tras compresión, reentradas tras una corrección amable hacia la nube, o rebotes en un borde externo son los patrones básicos.
- Si aparece una flecha temprana a mitad de barra y luego desaparece, espera la confirmación al cierre de barra si prefieres menos falsas señales.
- Gestiona la operación con el HUD de Riesgo:
-
- Coloca el stop protector aproximadamente más allá del límite estructural más cercano que el HUD resalta.
- Escala salidas en TP1, deja el resto para TP2 o sigue la línea de trailing sugerida.
- Si la Fuerza de Tendencia decae de fuerte a débil, considera salir antes.
- Filtros situacionales:
-
- Evita entradas cuando las nubes son delgadas y agitadas, o cuando el estado de fuerza está en EXIT.
- Favorece operaciones cuando la fuerza está aumentando, la nube se inclina y el precio interactúa limpiamente con los bordes.
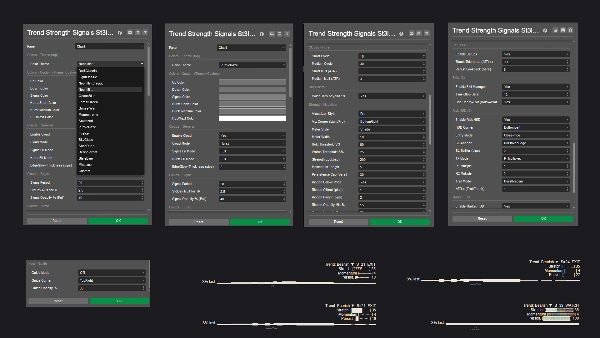
Personalización
- Cambia las esquinas del HUD, el estilo de visualización y el tema de color para que coincidan con tu espacio de trabajo.
- Los temas amigables para fondos claros mantienen el texto visible sobre fondos blancos; las paletas océano/bosque/atardecer añaden contraste sutil sin deslumbrar.
Lo que no
Esto no es un autotrader de caja negra. Es una ayuda para la toma de decisiones: enmarca la calidad de la tendencia, propone ubicaciones sensatas para el riesgo y destaca momentos de alta probabilidad—pero tú mantienes el control.
Resumen
Perfil del indicador
Valoraciones de clientes
0.0
Valoraciones: 0
Valoraciones de clientes
Este producto todavía no se ha valorado. ¿Ya lo ha probado? Sea el primero en informar a otros.
Conversación
Preguntas frecuentes
Los productos disponibles a través de cTrader Store, incluidos bots, indicadores y plugins para operar, son proporcionados por desarrolladores de terceros y están disponibles únicamente con fines informativos y de acceso técnico. cTrader Store no es un bróker, por lo que no proporciona asesoramiento de inversión, recomendaciones personales ni ninguna garantía de rentabilidad futura.


Precio
Desde 26/05/2025
451.48M
Volumen operado
61.16K
Pips ganados
15
Ventas
1.43K
Instalaciones gratis