説明
トレンドラインオシレーターは、現在の価格と最近検出された強気および弱気のトレンドライン間の正規化された距離に基づいて、トレーダーがトレンドとモメンタムを識別するのに役立ちます。
このインジケーターは、強気および弱気のモメンタム、シグナルラインのクロス、および複数の平滑化オプションを備えています。
使用方法
トレンドラインオシレーター は体系的に以下のように機能します:
- ピボットの高値と安値を特定します。
- ピボットを結んで強気(サポート)および弱気(レジスタンス)のトレンドラインを形成します。
- 現在の価格とこれらのトレンドライン間の距離(デルタ)を測定します。
- これらの距離を0から100の間で正規化してモメンタム値を作成します。
- よりクリーンなシグナルのために値を平滑化します。
- モメンタムがシグナルラインをクロスするときに強気および弱気のシグナルを生成します。
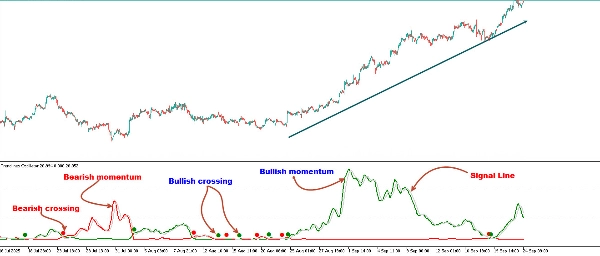
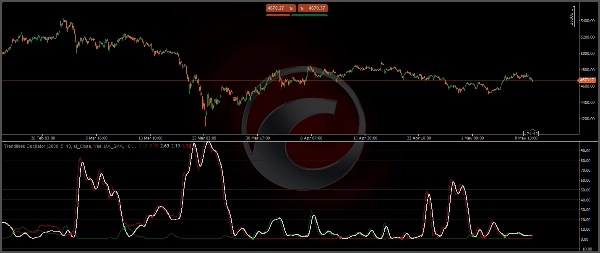
オシレーターは3つの主要なラインを表示します:
強気モメンタムライン(緑):最近の強気サポートトレンドラインから価格がどれだけ離れているかを計算して買い手の強さを測定します。
弱気モメンタムライン(赤):最近の弱気レジスタンストレンドラインから価格がどれだけ離れているかを計算して売り手の強さを測定します。
シグナルライン(灰色):モメンタムラインとのクロスオーバーを提供し、潜在的な取引機会を強調します。
一般的なルールとして、強気モメンタムラインが弱気モメンタムラインより上にある場合、それは買い手の強さを示します。これは、実際の価格がレジスタンストレンドラインよりもサポートトレンドラインからより遠いことを意味します。売り手の強さの場合はその逆です。
強気モメンタムを計算するために、ツールはまず価格の下にあるサポートとして機能する強気トレンドラインを特定します。次に、価格とこれらのトレンドライン間のデルタを測定し、その読みを表示されるモメンタム値に正規化します。
同じプロセスが弱気モメンタムにも使用されますが、価格の上にあるレジスタンスとして機能する弱気トレンドラインを使用します。
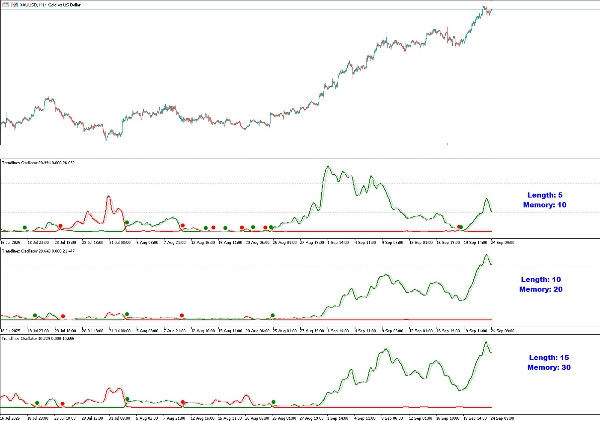
長さとメモリ
- 長さ:トレンドライン検出に使用される市場構造のサイズを決定します。大きな値はより広範なトレンドを捉え、小さな値は短期的な動きに対してツールをより敏感にします。
- メモリ:計算に考慮されるトレンドラインの数を制御します。高いメモリ値は長期分析のためにシグナルを平滑化し、小さいメモリ値はより迅速な反応を提供します。
長さとメモリの値を変更すると、ツールは異なるモメンタム値を表示します。
トレーダーは長さを調整してより大きなトレンドラインを検出し、メモリを調整してツールが考慮すべきトレンドラインの数を示すことができます。
上のチャートが示すように、小さい値はツールをより反応的にし、大きい値はより大きなトレンドを検出するのに役立ちます。
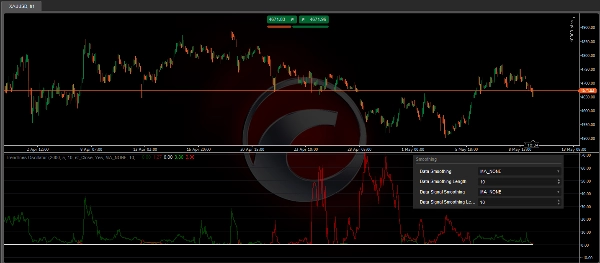
平滑化
- データ平滑化:生のモメンタム値に平滑化を適用します。
- シグナル平滑化:より明確なクロスポイントのためにシグナルライン自体を平滑化します。
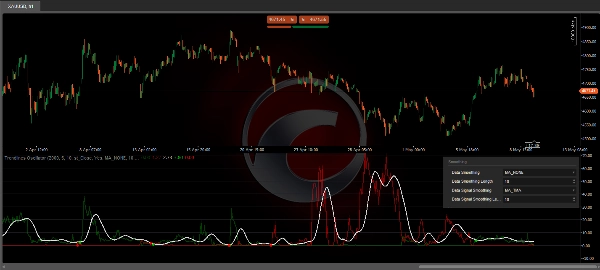
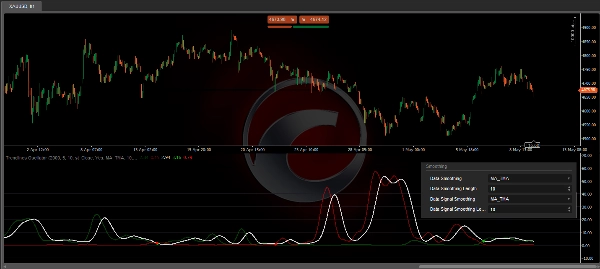
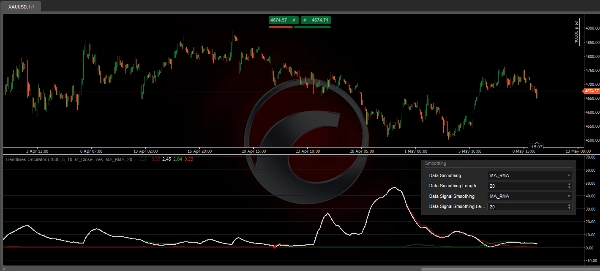
デフォルトでは、データはSMAで平滑化され、シグナルは長さ10の三角移動平均を使用します。トレーダーはデータとシグナルラインの両方を平滑化できます。
トレーダーは異なる方法、またはなしを選択できます。いくつかの例は添付画像に示されています。
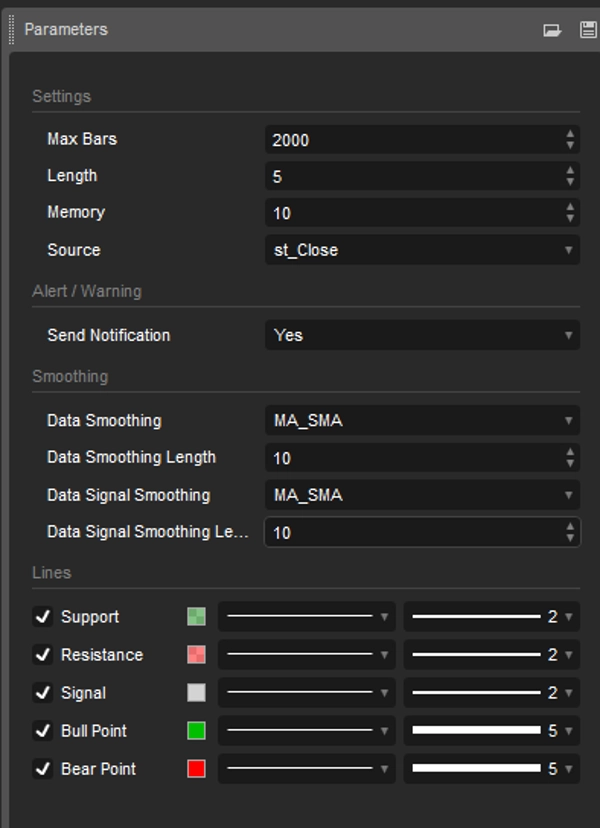
設定
- 長さ:トレンドライン検出に使用される市場構造のサイズ。
- メモリ:計算に使用されるトレンドラインの数。
- ソース:計算のソースはデフォルトで終値です。
- データ平滑化:平滑化方法と長さを選択します
- シグナル平滑化:平滑化方法と長さを選択します
- アラート:強気/弱気クロス時のアラート/通知
- スタイル:サポート/レジスタンス/シグナルラインの色、スタイル、幅を調整
トレンドラインオシレーター取引インジケーターは、以下を望むトレーダーに最適です:
- 移動平均やRSIのみに頼るのではなく、トレンドラインに基づくモメンタムの視点。
- 潜在的なエントリーとエグジットを示す明確な視覚的クロスオーバー。
- 異なる取引スタイルに適応するためのカスタマイズ可能な平滑化。
- リアルタイムで買い手と売り手の優勢を強調するツール。
- 構造的な市場分析とモメンタム計算を組み合わせることで、トレンドの継続と反転の両方の機会を見つける独自の優位性を提供します。
概要
Users can customize the indicator’s sensitivity and responsiveness by adjusting the Length (market structure size for trendline detection) and Memory (number of trendlines considered). The tool also offers data and signal smoothing options using various methods, including SMA and triangular moving averages, to provide clearer signals. The Trendlines Oscillator supports alerts for bullish and bearish crossovers and allows customization of line styles and colors. It provides a structural market analysis combined with momentum calculations to help traders assess buyer versus seller dominance and identify trend continuation or reversal opportunities.


