

説明
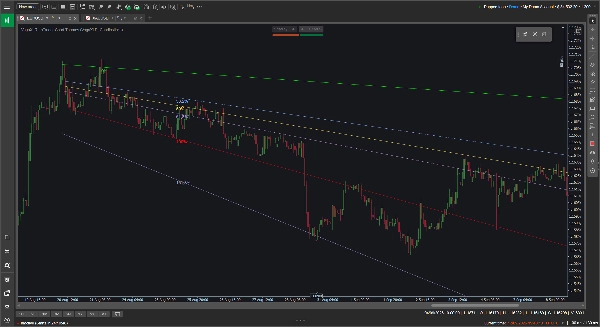
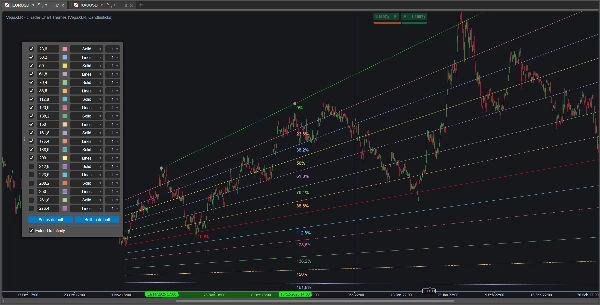
標準のフィボナッチツールは水平面に固定されており、明確な上昇または下降トレンドを追跡しているときには必ずしも役立ちません。VegaXLRカスタムフィボナッチツールは、価格の動きの実際の傾斜に適応する動的で角度のついたフィボナッチリトレースメントを描画できるようにすることで、この問題を解決します。
トレンドチャネルのマッピング、価格目標の予測、または斜めのサポートとレジスタンスを探す際に、より柔軟性を提供するよう設計されています。
🔥 主な特徴
- 動的な角度付きレベル: 中間レベルは自動的に計算され、0%および100%の基準トレンドラインに合わせて傾斜します。基準線をドラッグまたは調整すると、内部レベルが即座に更新されます。
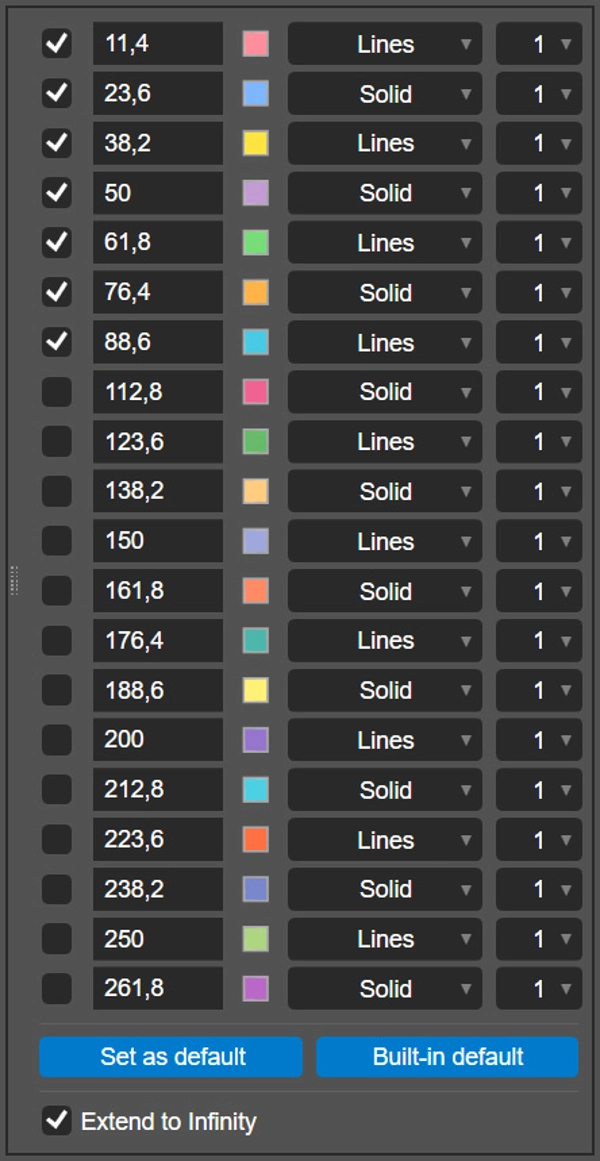
- 20の設定可能なレベル: 1つの描画につき最大20個の個別フィボナッチレベルを有効化および設定できます。
- レベルごとのカスタマイズ: 各ラインについて、正確な比率を設定し、カスタムカラーを選択し、線のスタイル(ソリッドやラインなど)を選び、1から8ピクセルの太さを設定できます。
- 無限に延長可能: 単一のトグルで、基準線とすべてのアクティブレベルをチャートの右側にまっすぐ投影できます。
- 設定の保存: 「デフォルトとして設定」ボタンをクリックして、カスタム比率、色、スタイルをローカルに保存します。プラグインは設定を記憶し、将来の描画に自動的に適用します。
- クロスプラットフォーム対応: このツールはWindowsおよびmacOSのcTraderデスクトップクライアントの両方で完全にサポートおよび最適化されています。
🖱️ 直感的なチャート上コントロール
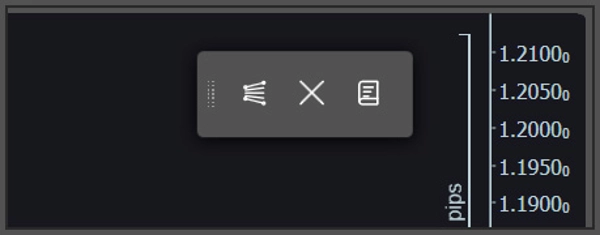
プラグインは深いインディケータメニューではなく、軽量で浮動するチャート上のツールバーに依存しています。
- クイック描画&クリア: ツールバーを使って新しいフィボナッチツールをチャートに配置したり、現在のすべての描画を安全にクリアしたりできます。伝統的な水平線や垂直線を描きたい場合は、描画中にShiftキーを押し続けてください。
- ポップアップ設定: 特定の描画をカスタマイズするには、その0%または100%の基準線を直接クリックしてください。設定パネルがチャート上にポップアップして簡単に調整できます。
⚙️ インディケータパラメータ
描画を開始する前に、cTraderインディケータパラメータでいくつかの基準線の設定を調整できます:
- 浮動ツールバーのデフォルト画面位置を変更(例:右上、下中央)。
- 設定パネルのデフォルトポップアップ位置を変更。
- すべてのフィボナッチパーセンテージラベルのオン/オフ切り替え。
概要
AI summary
VegaXLR - Custom Fibonacci Tool is a plugin for cTrader that enables drawing dynamic, angled Fibonacci retracements aligned with the slope of price trends, rather than fixed horizontal levels. This tool supports up to 20 individually configurable Fibonacci levels per drawing, allowing users to customize each level’s ratio, color, line style, and thickness. The retracement lines automatically adjust their angle when the baseline trendlines (0% and 100%) are moved, maintaining alignment with the price action slope.
Key features include an option to extend all active levels infinitely across the chart, saving custom settings as defaults for future use, and compatibility with both Windows and macOS cTrader desktop clients. The plugin uses an intuitive floating on-chart toolbar for quick drawing and clearing of Fibonacci tools, with a pop-up configuration panel accessible by clicking on baseline lines. Users can also toggle traditional horizontal or vertical lines by holding the Shift key while drawing.
Additional adjustable parameters include the default screen position of the toolbar, the pop-up panel location, and the display of Fibonacci percentage labels. VegaXLR is designed to enhance trend channel mapping, price target projection, and identification of diagonal support and resistance on cTrader charts.
Key features include an option to extend all active levels infinitely across the chart, saving custom settings as defaults for future use, and compatibility with both Windows and macOS cTrader desktop clients. The plugin uses an intuitive floating on-chart toolbar for quick drawing and clearing of Fibonacci tools, with a pop-up configuration panel accessible by clicking on baseline lines. Users can also toggle traditional horizontal or vertical lines by holding the Shift key while drawing.
Additional adjustable parameters include the default screen position of the toolbar, the pop-up panel location, and the display of Fibonacci percentage labels. VegaXLR is designed to enhance trend channel mapping, price target projection, and identification of diagonal support and resistance on cTrader charts.
プラグインのプロフィール
カスタマーレビュー
0.0
レビュー: 0
カスタマーレビュー
この商品にはまだレビューがありません。お使いになったことがある方は、ぜひレビューをお願いします。
ディスカッション
よくあるご質問
Chart UI Tools
cTrader Storeで入手可能な取引ボット、インジケーター、プラグインなどの商品は、第三者の開発者が提供するものであり、情報と技術の取得のみを目的としてご利用いただけます。cTrader Storeはブローカーではなく、投資助言や個人的な推奨を行うことも、将来のパフォーマンスを保証することもありません。
この作成者の他の商品
















![「Custom Timeframes [Iridio Capital]」ロゴ](https://cdn.ctrader.com/image/webp/4d75a920-23c7-4fea-a7b5-594a9d067f2e_63286)
価格
255
販売
1.5K
無料インストール