present
Kaydolun ve ilk alışverişinizde $50 indirim kazanın
Trading product for Donchian Channel with Timeframe Context Gösterge Donchian Channels, image 1
Donchian Channel with Timeframe Context
Gösterge
Sürüm 1.0, Feb 2026
Windows, Mac
Trading product for Donchian Channel with Timeframe Context Gösterge Donchian Channels, image 2
Trading product for Donchian Channel with Timeframe Context Gösterge Donchian Channels, image 3
Trading product for Donchian Channel with Timeframe Context Gösterge Donchian Channels, image 4
Trading product for Donchian Channel with Timeframe Context Gösterge Donchian Channels, image 5
Trading product for Donchian Channel with Timeframe Context Gösterge Donchian Channels, image 6
Başlangıç 28/01/2026
4
Satışlar

Açıklama

THE IDEA

A Donchian Channel that adds higher-timeframe range context instead of viewing every breakout in isolation.


THE PROBLEM

A standard Donchian Channel tells you when price reaches a recent extreme.

But a breakout does not happen in isolation.

A breakout on M15 may be significant — or it may simply be price moving inside a much larger Daily or Weekly range.

The same breakout can therefore have very different context depending on where it occurs within the higher-timeframe range.

The channel shows the breakout. But the channel alone does not show where that breakout sits within the bigger range.


THE CORE CONCEPT: THE CHANNEL SHOWS THE MOVE. THE HIGHER TIMEFRAME SHOWS WHERE IT HAPPENS.

A breakout is not only an event.

It also has a location.

Two breakouts can look identical on the execution timeframe while occurring at very different positions within the higher-timeframe range.

One may occur near the middle of the larger range.

Another may occur directly inside its upper boundary.

The price action may look the same.

The context is not.

This indicator makes that context visible by placing the previous completed higher-timeframe range directly on your current chart.

Instead of asking only:

"Did price break the channel?"

you can also ask:

"Where did the breakout happen?"


WHAT IT DOES

Donchian Channel with Timeframe Context combines two layers of information on a single chart:

1. Current-Timeframe Donchian

The standard Donchian Channel tracks the current market's recent high, low, and midpoint.

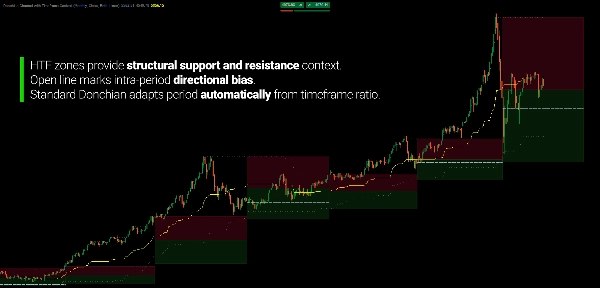
Its period is calculated automatically from the ratio between your chart timeframe and selected context timeframe. For example, a Weekly context on an H1 chart produces a 120-bar lookback.

You do not need to decide whether the channel should use 20, 50, or 100 bars.

The timeframe relationship defines the lookback.

2. Higher-Timeframe Context

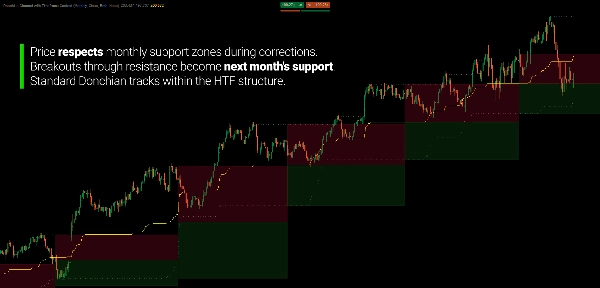
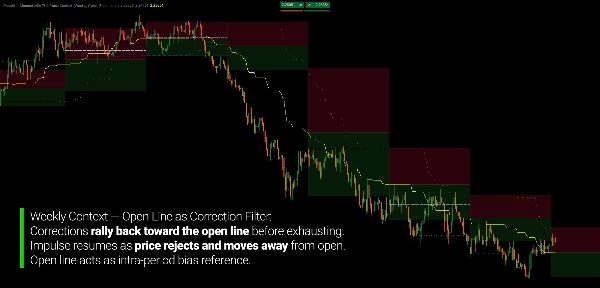
The previous completed higher-timeframe period's range is projected forward onto your current chart as support and resistance zones.

Its range is divided into two areas:

Support Zone
From the previous period's low to its midpoint.

Resistance Zone
From the midpoint to the previous period's high.

As price develops on your current timeframe, you can immediately see its position within that larger range.


TWO TIMEFRAMES. ONE CHART.

The current-timeframe Donchian shows the movement developing around the recent extremes.

The higher-timeframe range provides the larger reference frame.

For example:

Weekly context → H1 chart

or

Daily context → M5 chart

The lower timeframe remains the active movement.

The higher timeframe simply provides the surrounding range.

The channel shows what price is doing. The higher timeframe shows where it happens.


THE HIGHER TIMEFRAME DOESN'T OVERRIDE THE LOWER ONE

The higher-timeframe range is not a signal telling you what price must do.

It is a reference frame.

A lower-timeframe breakout can continue through higher-timeframe resistance.

A pullback can stop inside higher-timeframe support.

Price can also move completely beyond the previous range and enter new territory.

The purpose is not to predict which outcome will occur.

It is to make the larger range visible while you watch the smaller movement develop.


LET THE CONTEXT UPDATE ITSELF

The higher-timeframe zones are based on the previous completed period.

When a new higher-timeframe period begins, the context range updates.

For example:

Previous Week → Current Week

The previous week's high, low, and midpoint become the reference for the current week.

On an H1 chart, those boundaries remain visible while the current-period Donchian Channel continues to develop.

You therefore get a persistent reference without manually drawing the previous period's range.


TIMEFRAME CONTEXT IS YOUR CHOICE

Choose the higher timeframe that provides the context you want:

  • Monthly
  • Weekly
  • Daily
  • 4 Hour
  • 1 Hour
  • 30 Minute
  • 15 Minute
  • And other supported combinations

The indicator handles the corresponding Donchian period automatically.

You choose the context. The calculation adapts to it.


OPTIONAL OPEN PRICE REFERENCE

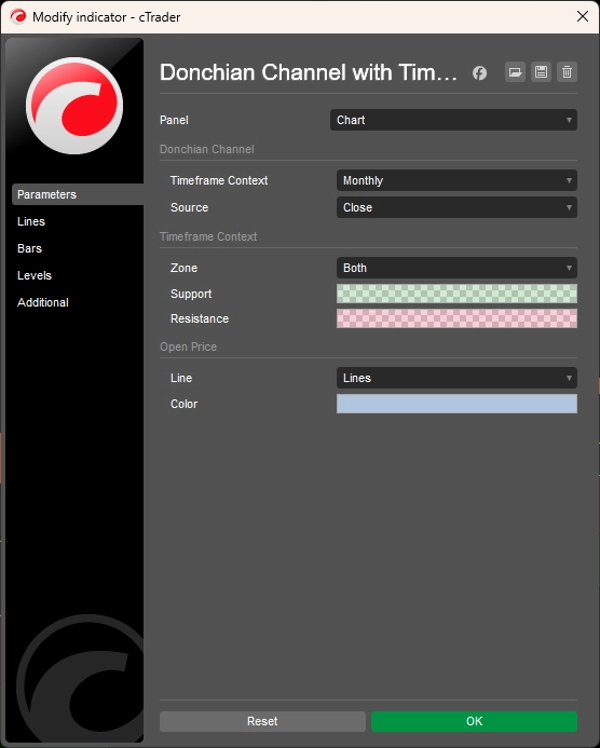
The current higher-timeframe period's opening price can also be displayed.

This gives you another reference for where price is trading relative to the opening price of the current higher-timeframe period.

Enable it when you want additional context.

Hide it when you want the chart focused on the two Donchian layers.


CHOOSE HOW THE CHANNEL IS CALCULATED

The Donchian boundaries can be calculated from:

Close

or

High / Low

Close-based calculation produces boundaries from closing prices.

High/Low calculation includes the full wick extremes and therefore represents a wider price range.

The same source selection is applied consistently to both the current-timeframe and higher-timeframe calculations.


BUILT FOR CONTEXT, NOT SIGNAL CHASING

Donchian Channel with Timeframe Context is not a breakout prediction system.

It does not tell you whether a breakout will succeed.

It gives you a defined environment in which to observe it.

Use it to study:

  • Breakouts
  • Pullbacks
  • Higher-timeframe boundaries
  • Position within a larger range
  • Expansion beyond previous extremes
  • Multi-timeframe price geometry
  • Current movement relative to the previous period

The standard Donchian tells you where the current extremes are.

The higher-timeframe context tells you where those extremes sit within the bigger range.


KEY FEATURES

  • Standard Donchian Channel
  • Automatic current-timeframe period calculation
  • Higher-timeframe range projection
  • Support and resistance context zones
  • Previous-period high, low, and midpoint
  • 13 selectable timeframe contexts, from Monthly through Minute 15
  • Optional higher-timeframe open price
  • Close or High/Low calculation modes
  • Configurable zone display: Both, Support only, Resistance only, or None
  • Support-only / Resistance-only display options
  • Real-time updates
  • Support for time-based and non-time-based charts, including Tick, Renko, and Range


---


Trading involves risk. This indicator is a technical analysis tool and should be used together with appropriate risk management.

Özet

YZ özeti
The Donchian Channel with Timeframe Context indicator enhances the traditional Donchian Channel by overlaying higher-timeframe structural support and resistance zones onto the current chart. It calculates the previous higher-timeframe period's price range and projects these as colored zones—support below the midpoint and resistance above—providing a multi-timeframe context for breakout and pullback analysis.

This dual-layer system automatically adapts the Donchian lookback period based on the ratio between the selected higher timeframe and the chart timeframe, eliminating manual period settings. It supports 13 timeframe options from Monthly to 15 Minutes and can be applied across various markets including forex pairs (EURUSD, GBPUSD, USDJPY, NZDUSD), commodities (XAUUSD), indices (NAS100), and cryptocurrencies (BTCUSD).

Key features include real-time updates of both standard and higher-timeframe channels, configurable visual zones with adjustable colors and transparency, an optional open price line marking the higher-timeframe period’s open, and flexible price source settings (close or high/low).

The indicator aids traders in filtering false breakouts by showing whether price movements occur within structural supply or demand zones on a higher timeframe. It is designed for trend-following, swing, and discretionary traders who use Donchian channels and seek enhanced structural context to better assess breakout significance and correction exhaustion without switching timeframes.
Gösterge profili

Müşteri değerlendirmeleri

0.0
Değerlendirmeler: 0
Müşteri değerlendirmeleri
Bu ürün için henüz bir değerlendirme yok. Ürünü denediniz mi? O zaman ona dair görüşlerini paylaşan ilk kişi olun!

Tartışma

SSS

Donchian Channels
cTrader Store üzerinden erişilebilen işlem botları, göstergeler ve eklentiler gibi ürünler, üçüncü taraf sağlayıcılar tarafından sağlanır ve yalnızca bilgilendirme ve teknik erişim amaçlarıyla sunulur. cTrader Store bir broker değildir ve yatırım tavsiyesi, kişisel öneriler vermez veya gelecekteki performansı garanti etmez.

Bu oluşturanın diğer ürünleri

Gösterge
Supertrend
Moving Average
Adaptive MA anchored to structural trend changes — no fixed period. Dual Supertrend + swing detection.
Gösterge
Fibonacci
Automated Fibonacci Retracement, Expansion, Fan & Time Zones from unified swing detection. Multi-timeframe capable.
Gösterge
Fibonacci
Auto-swing detection driving 7 Fibonacci projections: retracement, expansion, fan, time, pitchfork, channel, Gann.
Gösterge
Support & Resistance
Structural analysis framework designed to quantify swing point behavior at psychological price levels
Gösterge
EMA
SMA
+2
Drag MA to any swing point — MA anchors and recalculates instantly. Not period-based. Structural.
"Structural Supertrend" logosu
En yüksek puanlı
4.7
(4)
$20
Gösterge
Supertrend
Noise-filtered Supertrend, swing strength scoring, and S/R zones with polarity tracking. Structure over signals.
"Fibonacci Channel" logosu
En yüksek puanlı
4.6
(5)
$25
Gösterge
Channel
Fibonacci
Anchor-based Fibonacci channel that grows with the market. Seven display modes, auto-direction, fully draggable.
Gösterge
Volume
Custom range volume profile between two draggable anchors. Auto source timeframe, Total/Up-Down/Delta, POC, Value Area.

Şunları da beğenebilirsiniz

Gösterge
Volume
Key Levels
+2
Support and resistance from a rolling volume profile, ranked by strength or recency, updated live.
Gösterge
SMC
Prop
+13
Perfect for traders who demand a clear overview of multiple timeframes at a glance.
Gösterge
CHOCH
Inducement
+5
TradeLens - Frame the Trade. Refine the Entry. Two Timeframes. One Decision.
Gösterge
ATR
MACD
+15
Professional trading indicator: 5 cloud types, 9 ML engines, SMC Order Blocks, Pandas-TA & live dashboard.
Gösterge
BOS
CHOCH
+2
The full SMC suite: BOS / CHoCH / MSS, FVG, liquidity, order blocks and a 0-100 confluence score. No repaint.
"OR Session Zones" logosu
En yüksek puanlı
4.2
(5)
$25
/
$45
Gösterge
Forex
EURUSD
+7
A high‑precision Opening Range indicator that detects session opens (NY, London, EU, Tokyo, Shanghai)
Gösterge
SMC
Prop
+7
institutional-level market analysis
Gösterge
Prop
Forex
+13
Volume Meter
Gösterge
Signal
USDJPY
See USD demand in one line—Composite OBV fuses six major FX pairs into a clear momentum gauge.
Gösterge
BOS
MSS
+5
Your entire ICT session map, structure engine, and key levels — No manual work. One indicator. Every session!
Gösterge
ATR
EMA
+2
Eight-EMA ribbon with ATR trade zones, a nine-symbol screener and a five-timeframe trend dashboard.
Gösterge
Forex
BTCUSD
+11
📈 Adaptive ALMA-Gaussian hybrid trend filter with precision smoothing and clear buy/sell signals.
Gösterge
ATR
EMA
+3
The UTBot you know from TradingView — now on cTrader with confirmed signals, VWAP, EMA and session overlays.
Gösterge
Prop
Forex
+5
Transform your approach to trading with our innovative Pivot Point Indicator.
Gösterge
Prop
Forex
+4
Personal trade tracker for a single symbol. Clear net profit summary — FreshNet, ManageNet, DayNet, WTDNet, MTDNet.
Gösterge
ATR
Prop
+13
Enhance trading with ATR Bands! Visualize market volatility using dynamic upper and lower ATR bands for precise decision
Gösterge
Volume
Channel
+3
A higher-timeframe log-regression channel with a volume profile, Point of Control and session levels.
Gösterge
ATR
Key Levels
It combines the trend-filtering power of Renko charts with the volatility tracking of ATR Bands

Fiyat

Başlangıç 28/01/2026
4
Satışlar