

"Auto-Draw Fibonacci Suite" 로고
지표
버전 1.1, Feb 2026
Windows, Mac
"Auto-Draw Fibonacci Suite" 업로드된 이미지
가입일 28/01/2026
2
판매

WHAT IT DOES

Auto-Draw Fibonacci Suite automatically detects swing structures and draws seven geometric tools simultaneously—four Fibonacci tools plus three complementary geometric analysis tools—with no manual placement required.

Traditional Fibonacci analysis means identifying swings, drawing retracements, redrawing fans from the same swings, manually placing pitchforks, adjusting time zones. Every tool requires separate setup. Every new swing means redrawing everything.

This indicator automates that entire process.

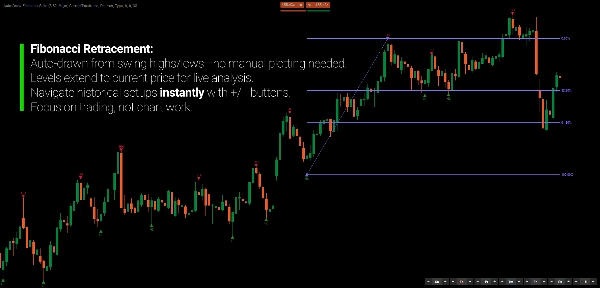
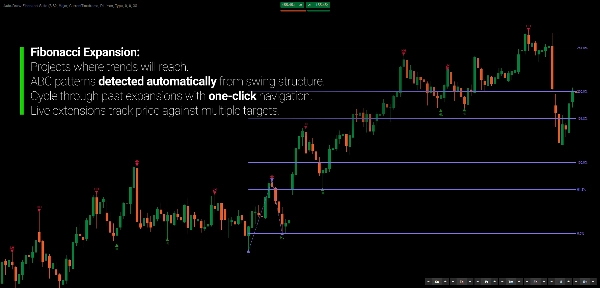
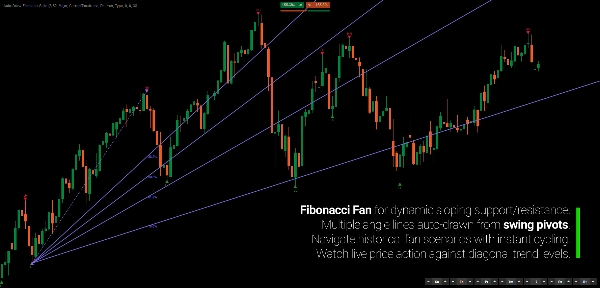
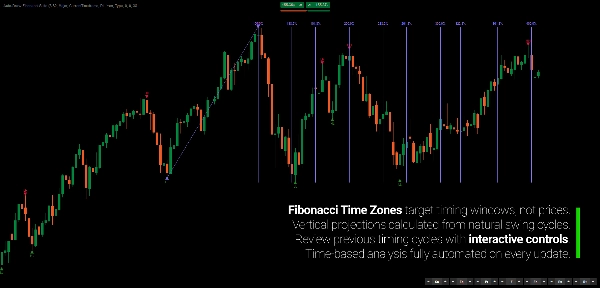
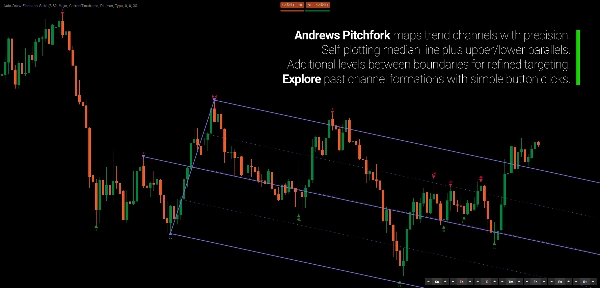
Swings are detected once through regression method. All seven geometric tools—Fibonacci retracement, expansion, fan, and time zones, plus Andrews Pitchfork, equidistant channel, and Gann fan—reference those same swing points automatically.

When price creates a new swing, every active tool updates in real-time. No redrawing. No manual swing selection. No geometric inconsistency from using different pivots across tools.


THE CORE BENEFIT

Manual Approach:

  1. Identify swing high and swing low visually
  2. Draw Fibonacci retracement
  3. Identify same swings again, draw fan
  4. Find three swings, manually place pitchfork
  5. Price creates new swing → repeat entire process

Auto-Draw Approach:

  1. Indicator detects swings automatically
  2. All seven tools draw and update themselves
  3. Price creates new swing → everything updates automatically
  4. The difference is structural. Instead of seven separate manual workflows, you have one automated detection system projecting across all geometric domains—Fibonacci-based tools for ratio analysis and three additional geometric frameworks for comprehensive market structure mapping.


THE TOOL SUITE

Four Fibonacci Tools:

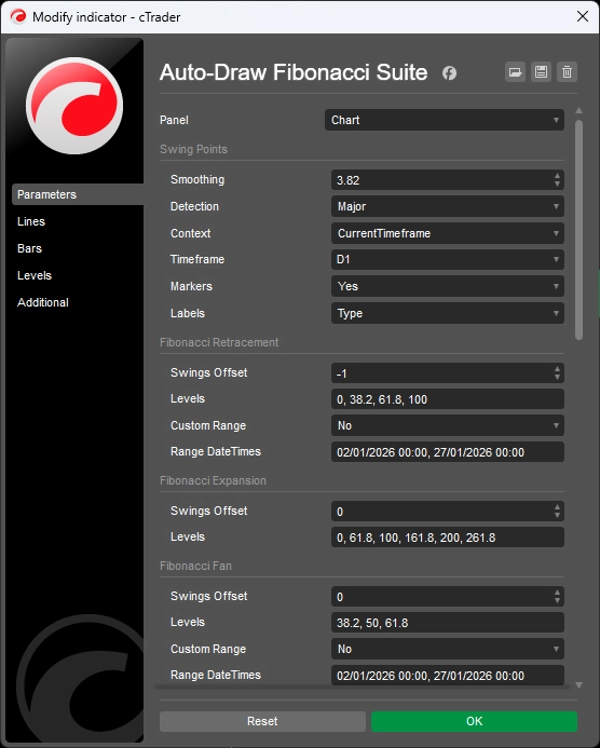
  • Fibonacci Retracement — horizontal levels (0%, 38.2%, 61.8%, 100%)
  • Fibonacci Expansion — projection targets beyond third swing
  • Fibonacci Fan — diagonal trendlines from pivot points
  • Fibonacci Time Zones — vertical time projection

Three Complementary Geometric Tools:

  • Andrews Pitchfork — three-point median with parallel channels
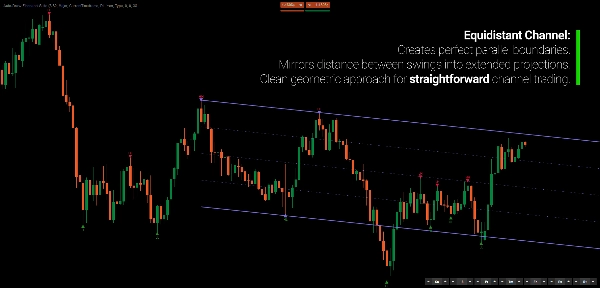
  • Equidistant Channel — parallel channel with intermediate levels
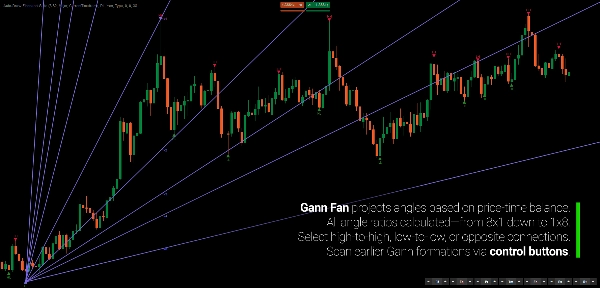
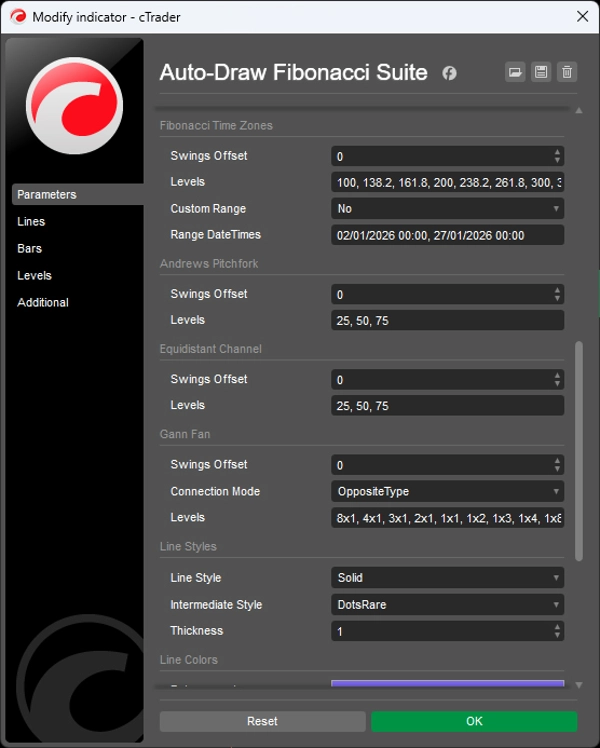
  • Gann Fan — price-to-time angle projections (8x1, 4x1, 2x1, 1x1, 1x2…)

Each tool can be enabled independently. All reference the same underlying swing detection.


UNIFIED SWING DETECTION

Three detection modes control swing sensitivity:

  • Major — fewer, stronger swings (confirmed by closes)
  • Standard — balanced granularity (most common)
  • Minor — detects inner swings within trends (maximum detail)

Swings are automatically classified (HH/LL/LH/HL) and measured by depth, volume, and duration. Visual markers show confirmed swings (triangles), unconfirmed swings (circles), and inner swings (squares).


INTERACTIVE OFFSET CONTROLS

Seven button groups (one per tool) let you instantly adjust which historical swings each geometric projection uses:

  • 0 — latest swing structure
  • -1 — previous structure
  • -2 — two structures back

Walk backward through swing history to see how geometric relationships evolved at previous structural points. Change any tool's reference swings without affecting others.


MULTI-TIMEFRAME SUPPORT

Apply swing detection to higher timeframe while viewing lower timeframe chart. See Daily swings and all geometric projections on your H1 chart—no timeframe switching needed.


KEY FEATURES

  • Automatic swing detection through regression methodology
  • Seven geometric tools auto-drawn from unified swing references
  • Real-time updates when new swings form
  • Interactive offset controls for each tool
  • Multi-timeframe mode (analyze Daily, trade H1)
  • Three detection modes (Major/Standard/Minor)
  • Swing classification (HH/LL/LH/HL) and metrics
  • Smart swing grouping (eliminates redundant intermediate swings)
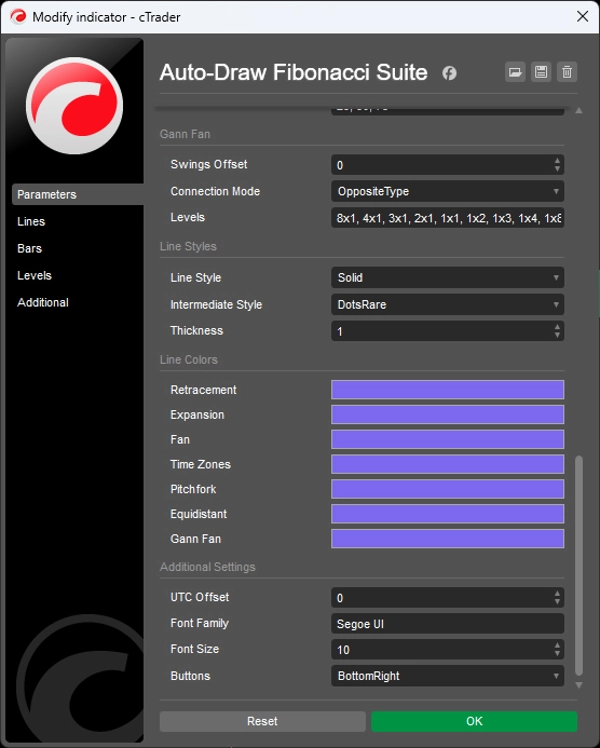
  • Fully customizable levels, colors, styles
  • Highlighted source swings for active tools


WHO IT'S FOR

This indicator is for traders who understand Fibonacci and geometric analysis tools but don't want to spend time manually placing and redrawing them.

If you use multiple Fibonacci projections and constantly redraw as price develops—or avoid certain tools because manual placement is too tedious—this suite automates that workflow.

It's well suited for swing and position traders who need geometric reference across multiple tools, multi-timeframe analysts who want higher-timeframe structure on execution charts, and discretionary traders who value geometric confluence but not the overhead of manual tool management.

This is not a signal system. It's an automation tool for traders who already think in Fibonacci and geometric terms and want their analysis to update itself.


WHAT MAKES IT DIFFERENT

Most geometric analysis indicators draw one tool type. This suite draws seven simultaneously from unified swing detection.

Most require manual swing selection. This automates swing identification and updates all tools in real-time.

Most treat each tool independently. This maintains geometric coherence by ensuring all projections reference the same underlying structures.

The result: complete multi-framework geometric analysis without constant redrawing.


---


UNDERSTANDING FIBONACCI AS GEOMETRIC LANGUAGE

Fibonacci analysis is often misunderstood as predictive—as if markets "respect" certain ratios. This misses the fundamental principle.

Fibonacci ratios don't predict where price will go. They provide a standardized geometric vocabulary for describing how price moves in relation to prior structure. A retracement to 61.8% represents a geometric relationship between current correction and prior impulse—not "support" in a causal sense.

The value lies in geometric coherence, not individual levels. When multiple projections converge—retracement level aligning with fan angle and time zone—that convergence reflects structural consistency across different measurement domains.

Markets don't target Fibonacci levels. When geometric projections align, that alignment reveals underlying structural order. This is why isolated levels have limited value while convergent geometric structures often mark inflection points.

The geometry isn't the cause. It's the descriptive language of structural relationships.


---


Trading involves risk. This indicator is a technical analysis tool—always apply proper risk management.


지표 프로필
0.0
리뷰: 0
고객 리뷰
이 상품에 대한 리뷰가 아직 없습니다. 이미 사용해 보셨나요? 다른 사람들에게 가장 먼저 소개해 주세요!
Fibonacci
트레이딩 봇, 지표, 플러그인 등 cTrader Store에서 제공되는 상품은 제3자 개발자에 의해 제공되며, 이는 단순히 정보 및 기술적 접근을 목적으로 제공된 것입니다. cTrader Store는 중개인이 아니며, 투자 조언, 개인별 추천 또는 향후 성과에 대한 어떠한 보장도 제공하지 않습니다.

이 작성자의 상품 더 보기

지표
Supertrend
Adaptive MA anchored to structural trend changes — no fixed period. Dual Supertrend + swing detection.
지표
BTCUSD
EURUSD
+5
Noise-filtered Supertrend, swing strength scoring, and S/R zones with polarity tracking. Structure over signals.
지표
Fibonacci
Anchor-based Fibonacci channel that grows with the market. Seven display modes, auto-direction, fully draggable.

좋아하실 만한 다른 항목

지표
ATR
RSI
+16
Multi-timeframe trend indicator using EMA, MACD & ADX to confirm high-probability buy and sell bias.
지표
Prop
Forex
+11
Market Structure Shift – Professional Market Structure Oscillator
지표
Prop
VWAP
+5
Multi-anchor VWAP indicator for cTrader. Plots two VWAP lines (red and blue) with selectable anchors.
지표
AI
SMC
+11
Perfect Entry Price designed to help traders identify the most accurate and reliable price levels for market entries
지표
Signal
Cumulative Volume Delta tracks the net difference in tick volume between buying and selling pressure over time
지표
Key Levels
Drawdown Monitor
+1
Real-time position monitor with break-even levels, MTF pivots, profit targets & alerts. Essential risk tool.
지표
Prop
Forex
+5
Transform your approach to trading with our innovative Pivot Point Indicator.
지표
Prop
Forex
+10
Support and Resistance Line Indicator with Higher Timeframe Filter
지표
Signal
Breakout
+1
Bolliger Bands + Hamster-Coder™ Timeframe Decoupling
지표
ATR
RSI
+6
📊Zones Supply & Demand: Identifies key price levels with high volume concentration, marking Supply/Demand Zones & Marke
지표
Flag
Key Levels
+5
Zig Zag filters out minor price noise and connects only the most significant swing and lows for key turning points.
"ORB v1" 로고
인기
5.0
(1)
$19
지표
Breakout
Opening Range Breakout (ORB) - Visual Edition
지표
ADX
ATR
+5
Signal Quality Score - 0-100 filter combining RSI, Volume, ATR, Trend Strength & Alignment. Works on ANY chart type.
지표
ATR
VWAP
+17
Hybrid adaptive trend filter with clean Buy/Sell signals, dynamic bands and zero-repaint analysis.
지표
MACD
Prop
+14
Customize the MACD! Choose colors, get real-time tick updates, and see crossover points for enhanced trading precision.
지표
VWAP
Forex
+2
Custom VWAP Indicator for cTrader
지표
RSI
MACD
+5
An advanced indicator merging Smart Money Concepts, Gann Sq9 targets, Monte Carlo analysis, and MTF trend bias.
지표
Forex
Crypto
+6
Smart Price Action Scanner 🔍 Detects engulfing, pin bars & inside bars with trend filter for cleaner entries ✅
가입일 28/01/2026
2
판매





















