

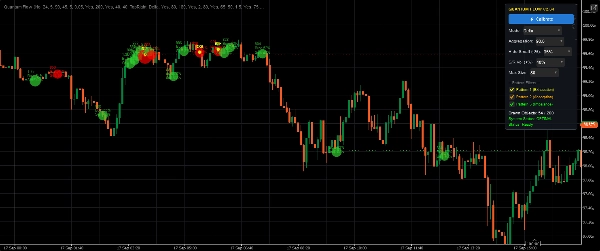
설명
QuantumFlow — 고급 주문 흐름 및 거래량 분석
QuantumFlow는 cTrader용으로 설계된 고정밀 주문 흐름 지표입니다. 틱 단위 시장 활동을 동적 거래량 클러스터로 변환하고 실시간으로 기관 시장 발자국을 자동으로 강조 표시합니다.
시장 데이터 및 분석 조건
- 틱 거래량 및 델타: 원시 틱 분포를 분석하여 가격 수준별 매수 및 매도 공격성을 구분합니다.
- 동적 범위 집계: 고정된 바 수 대신 시장 변동성(ATR)을 기반으로 틱을 적응형 클러스터로 그룹화합니다.
- 세션 경계: 일일 고가/저가 상대 범위를 지속적으로 추적하여 거래량 중요도를 측정합니다.
시각적 요소 및 신호 해석
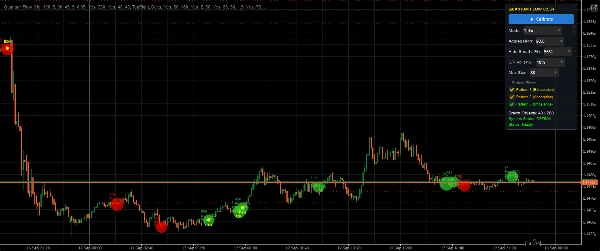
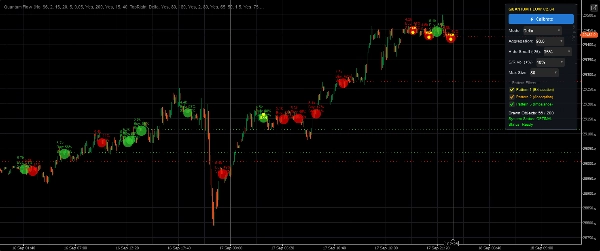
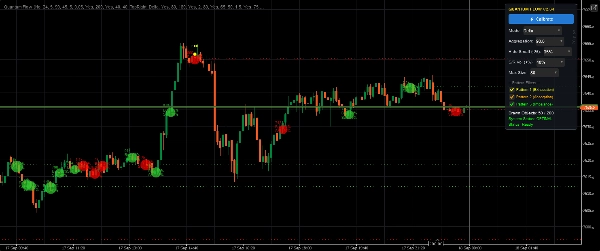
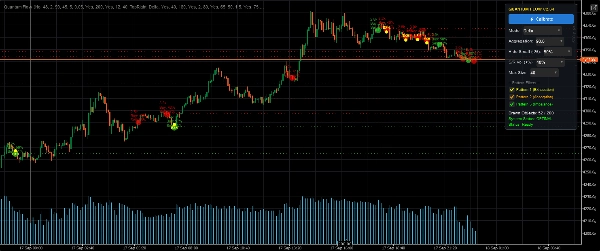
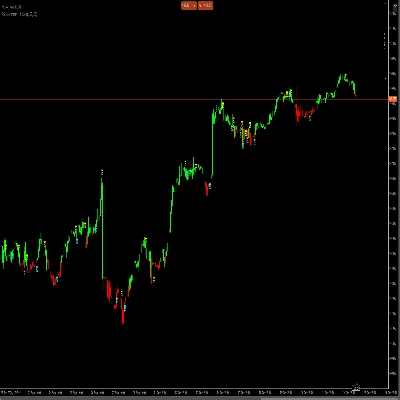
- 거래량 버블(시각적 클러스터): 버블 크기는 총 거래량에 따라 조정됩니다. 녹색 노드는 순매수 압력을, 빨간 노드는 순매도 압력을 나타냅니다.
- 노란 점(소진): 일일 고가/저가 근처에서 약한 후속 움직임과 함께 극심한 거래량 급증을 표시하여 시장 피로 또는 잠재적 반전을 신호합니다.
- 주황/청록 점(갇힌 트레이더): 극단적인 지점에서 대량 거래량 흡수를 강조 표시합니다(예: 가격을 더 이상 올리지 못하는 강한 매수세로 공격적인 매수자를 가둠).
- 라임/마젠타 점(불균형): 한쪽이 높은 거래량 속도로 델타를 지배하는 공격적인 방향성 주도권을 감지합니다.
- 거래량 지지/저항선: 고거래량 노드에 자동으로 그려지는 점선 수평선으로 주요 지지 및 저항 구역 역할을 합니다.
주요 설정 및 보정
- 자동 보정: 실시간 ATR 및 이력을 기반으로 임계값(집계, 거래량 필터, 패턴 민감도)을 동적으로 재계산하는 원클릭 알고리즘입니다.
- 집계 민감도: 가격 틱이 시각적 클러스터로 얼마나 밀접하게 그룹화되는지 제어합니다.
- 패턴 필터: 사용자 지정 거래량 임계값(
ExhMinVolFilter,TrappedMinVolume,ImbalanceMinVolume)으로 유동성 낮은 시간대의 노이즈를 필터링합니다. - 성능 보호: 내장 자동 스로틀링으로 고변동성 이벤트 중 플랫폼 지연을 방지하기 위해 활성 차트 객체 수를 제한합니다.
일반적인 사용 사례 및 거래 시나리오
- 돌파 검증: 움직임 방향의 강한 불균형 신호를 찾아 돌파를 확인합니다.
- 페이드 및 반전 거래: 일일 고가 또는 저가에서 기관 소진(소진 점)을 포착하여 빠른 평균회귀 진입을 합니다.
- 유동성 스윕: 가격이 주요 수준을 스윕하고 반락할 때 갇힌 시장 참가자(갇힌 트레이더 신호)에 반대 방향으로 거래합니다.
대상 청중 및 경험 수준
- 트레이더 프로필: 데이 트레이더, 스캘퍼, 주문 흐름/발자국 애호가에게 이상적입니다.
- 숙련도 수준: 거래량 델타, 유동성 흡수 및 시장 구조 역학에 익숙한 중급에서 고급 트레이더에게 가장 적합합니다.
중요 사용 주의사항 및 제한 사항
⚠️ 데이터 요구 사항: QuantumFlow는 cTrader 브로커가 제공하는 정확한 틱 거래량 데이터에 의존합니다. 성능은 고품질 틱 피드에 따라 달라집니다.
💡 최선의 방법: 주문 흐름 신호를 단독으로 사용하지 마십시오. 항상 QuantumFlow 시각적 패턴을 상위 시간대 시장 구조 및 주요 지지/저항 수준과 결합하십시오.
요약
AI summary
QuantumOrderFlow is an advanced order flow indicator for the cTrader platform that provides real-time analysis of institutional volume patterns. It processes tick-by-tick market data to create dynamic volume clusters, highlighting buy and sell aggression at each price level through tick volume and delta analysis. The tool uses adaptive range aggregation based on market volatility (ATR) and tracks session boundaries to assess volume significance relative to daily high and low ranges.
Visual elements include volume bubbles scaled by total volume with color-coded buying or selling pressure, and various signal dots indicating market conditions such as exhaustion near daily extremes, trapped traders at volume absorption points, and aggressive directional imbalances. It also automatically draws volume-based support and resistance lines at key price levels.
QuantumOrderFlow features one-click auto-calibration that adjusts thresholds dynamically using live ATR and historical data. Users can customize aggregation sensitivity and pattern filters to reduce noise during low liquidity periods. Performance protection limits chart objects to maintain platform responsiveness during volatile market events.
Typical applications include breakout validation, reversal trading by spotting institutional exhaustion, and trading liquidity sweeps against trapped participants. The indicator is designed for intermediate to advanced day traders and scalpers familiar with volume delta, liquidity absorption, and market structure concepts. It requires accurate tick volume data from the broker for optimal performance and is intended to be used alongside higher timeframe market structure analysis.
지표 프로필
지표 카테고리
패턴
출력 유형
시각화
신호
데이터 요구 사항
틱 데이터
거래량
지원되는 신호
레벨 터치
고객 리뷰
0.0
리뷰: 0
고객 리뷰
이 상품에 대한 리뷰가 아직 없습니다. 이미 사용해 보셨나요? 다른 사람들에게 가장 먼저 소개해 주세요!
상담
자주 묻는 질문(FAQ)
Key Levels
Imbalance
Volume
Market Structure
Supply & Demand
VWAP
Support & Resistance
트레이딩 봇, 지표, 플러그인 등 cTrader Store에서 제공되는 상품은 제3자 개발자에 의해 제공되며, 이는 단순히 정보 및 기술적 접근을 목적으로 제공된 것입니다. cTrader Store는 중개인이 아니며, 투자 조언, 개인별 추천 또는 향후 성과에 대한 어떠한 보장도 제공하지 않습니다.

가격
가입일 04/02/2025