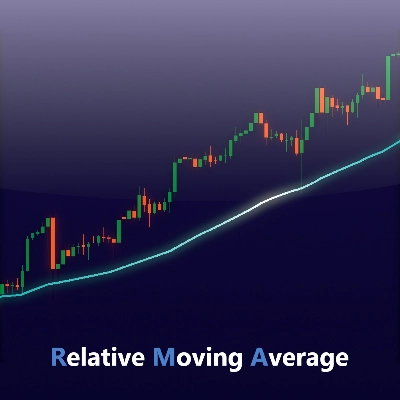
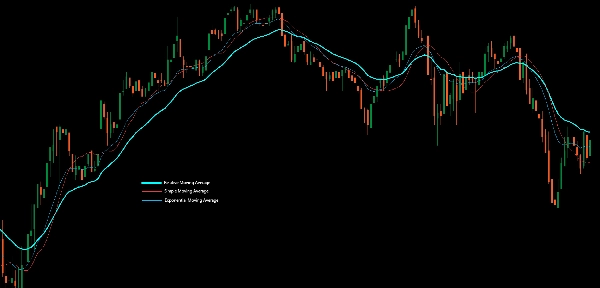
ขอแนะนำ ตัวบ่งชี้ค่าเฉลี่ยเคลื่อนที่สัมพัทธ์ (RMA) ที่มีให้ใช้งานบน cTrader แล้ว!
ค่าเฉลี่ยเคลื่อนที่สัมพัทธ์ (RMA) — หรือที่รู้จักกันในชื่อ ค่าเฉลี่ยเคลื่อนที่แบบเรียบ (SMMA) — เป็นประเภทของค่าเฉลี่ยเคลื่อนที่ที่มีเป้าหมายเพื่อลดความล่าช้าในขณะที่ยังคงความเรียบของเส้นโค้งไว้ สูตรเดียวกันนี้ถูกใช้โดย ฟังก์ชัน “RMA” ในตัวของ TradingView ซึ่งถูกใช้กันอย่างแพร่หลายในตัวบ่งชี้ยอดนิยม เช่น ดัชนีความแข็งแกร่งสัมพัทธ์ (RSI).
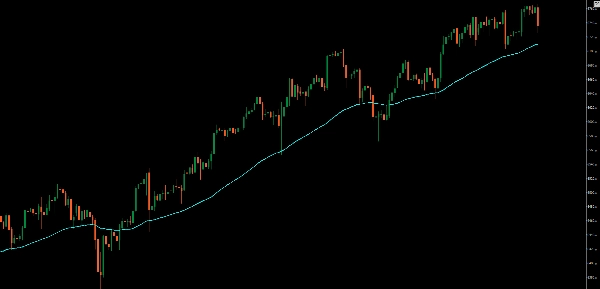
RMA ถูกออกแบบมาเพื่อสร้างสมดุลระหว่างความไวและความมั่นคง มันอัปเดตได้เรียบกว่าค่าเฉลี่ยเคลื่อนที่แบบ เอ็กซ์โพเนนเชียล (EMA) แต่ตอบสนองต่อการเปลี่ยนแปลงราคาที่รวดเร็วกว่าค่าเฉลี่ยเคลื่อนที่แบบ ง่าย (SMA).
ความแตกต่าง:
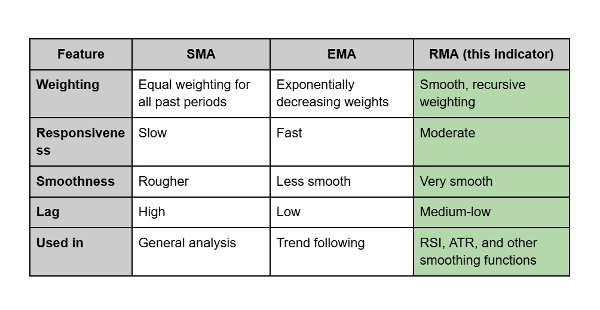
- ค่าเฉลี่ยเคลื่อนที่แบบ SMA ให้ค่าเฉลี่ยราคาทั้งหมดเท่าเทียมกัน ส่งผลให้เกิดความล่าช้าและความไม่เรียบของเส้น.
- ค่าเฉลี่ยเคลื่อนที่แบบ EMA ให้ความสำคัญกับราคาล่าสุดมากกว่า ทำให้ตอบสนองได้ดีแต่บางครั้งก็มีเสียงรบกวน.
- ในทางกลับกัน RMA ผสมผสานข้อดีของทั้งสองแบบ: มันช่วยลดความผันผวนในขณะที่ยังคงตอบสนองต่อการเปลี่ยนแปลงราคาได้ทันเวลา.
การใช้งานในทางปฏิบัติ:
เทรดเดอร์มักใช้ RMA เป็น เส้นแนวโน้มที่เรียบกว่า หรือเป็นส่วนหนึ่งของ ตัวบ่งชี้โมเมนตัม ซึ่งมีประสิทธิภาพอย่างยิ่งเมื่อคุณต้องการกรองเสียงรบกวนโดยไม่เพิ่มความล่าช้าอย่างมีนัยสำคัญ — เหมาะสำหรับการยืนยันแนวโน้มระยะยาวหรือสนับสนุนการวิเคราะห์ภาวะซื้อเกิน/ขายเกิน.


